Cost of Living Wichita KS: A Practical Breakdown

A single adult in the Wichita metro needs an estimated $20.78 an hour to cover basic necessities, while median gross rent in the city is $975 a month. Wichita can be affordable, but that depends on household income, housing choice, and recurring costs beyond rent.
The gap between a basic-needs wage and housing costs is a better starting point than a single citywide cost index. For a full-time worker, MIT's living-wage estimate translates to about $43,222 in gross annual income; Kansas's $7.25 hourly minimum wage is well below that benchmark. The estimate covers basic necessities, not discretionary spending or savings, and it changes substantially with household size and children (MIT's Wichita metro living-wage calculation; U.S. Census Bureau QuickFacts for Wichita).
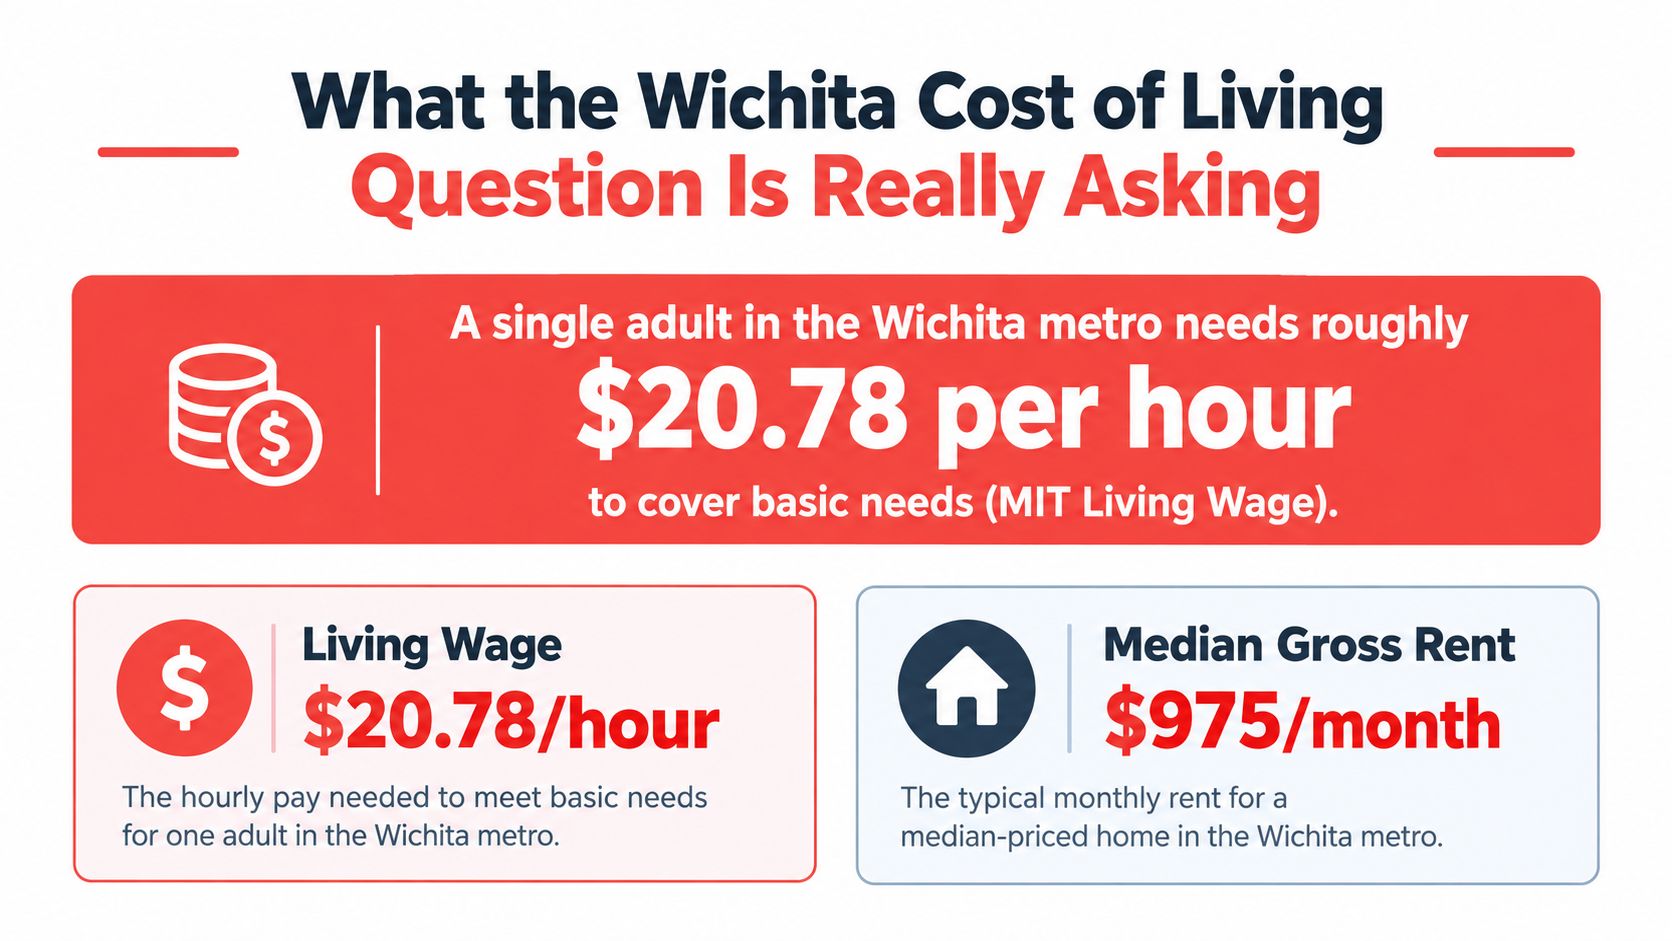
Table of Contents
- What the Wichita Cost of Living Question Is Really Asking
- Housing Costs in Wichita vs National and Regional Benchmarks
- Utilities, Groceries, and Transportation in Wichita
- How Wichita Cost of Living Shifts by Household Profile
- Reading Neighborhood-Level Cost Signals in Wichita
- Is Wichita Still Affordable or Just Inexpensive for Now
- A Wichita Affordability Checklist for Prospective Movers
- Frequently Asked Questions
What the Wichita Cost of Living Question Is Really Asking
“Cost of living Wichita KS” isn't answered by rent alone, or by a ranking that compresses groceries, taxes, utilities, and transportation into one score. The useful question is whether a particular household can cover its actual housing and daily costs on its income, while leaving room for bills that fluctuate or arrive irregularly.
The living-wage estimate gives one useful baseline. It represents the estimated hourly pay a single adult in the Wichita metro would need to cover basic needs while working full time. It isn't the average local wage, and it doesn't promise that someone earning that amount will have savings or financial breathing room (MIT Living Wage Calculation for Wichita).
The minimum-wage comparison makes the limitation of headline affordability clear: lower local housing costs don't automatically make every household's budget workable. Household composition matters, too. MIT's estimate rises to $35.74 an hour for one adult supporting one child, $45.01 for one adult supporting two children, and $54.33 for one adult supporting three children. Those figures show why a single-worker budget can't stand in for a family's needs (MIT Living Wage Calculation for Wichita).
The practical test: Compare your expected take-home income with the real cost of your housing, utilities, transport, and household needs. A citywide median is a reference point, not a personal budget.
The sections below focus on that distinction: first the housing numbers, then recurring expenses, household profiles, neighborhood variation, and affordability trends. The aim is to show where Wichita's cost advantage is strongest and what a headline figure leaves out.
Housing Costs in Wichita vs National and Regional Benchmarks
Housing is where Wichita's affordability advantage concentrates. Census estimates for 2020–2024 put the city's median owner-occupied home value at $190,800 and median gross rent at $975 a month, while monthly owner costs run $1,480 with a mortgage and $590 without one. The owner figures bundle taxes, insurance, and other selected expenses, so they are not equivalent to principal and interest alone (U.S. Census Bureau QuickFacts for Wichita).
| Metric | Wichita |
|---|---|
| Median gross rent | $975/month |
| Median owner-occupied home value | $190,800 |
| Monthly owner costs with a mortgage | $1,480 |
| Monthly owner costs without a mortgage | $590 |
State and national medians for these categories were not published in the cited sources, so treat this table as a Wichita baseline rather than a full benchmark comparison. Independent estimates describe Wichita housing values as low relative to national benchmarks, which is consistent with what a $190,800 median buys here compared with larger metros (Wichita housing-cost estimates).
Income determines what those numbers mean in practice. Median household income stands at $64,620, and median gross rent annualizes to $11,700, about 18.1% of that income (U.S. Census Bureau QuickFacts). That ratio flatters below-median households: a renter earning half the median commits roughly twice the share to rent, before utilities enter the calculation.
The split matters by household type. A single renter feels the $975 figure directly. An owner with a mortgage carries $1,480 plus maintenance, while a mortgage-free owner drops to $590, the widest gap in the table.
Buyers should also separate a low purchase price from a low all-in monthly cost, since property taxes, insurance, and a home's condition can erode part of the price advantage. For readers weighing Wichita against options abroad, a guide that helps you compare living costs across countries shows why a single index misses differences in taxes and household spending. For statewide context, the Kansas relocation data on ReloMaps sits alongside the specific Wichita addresses you are pricing.
Utilities, Groceries, and Transportation in Wichita
Housing is only the first line in a Wichita budget. One published estimate breaks monthly utilities into $127 for electricity, $73 for natural gas, $65 for water and sewer, and $69 for internet, roughly $334 total (City of Wichita utilities information). Actual bills shift with floor area, insulation, HVAC efficiency, occupancy, and water use, so treat that figure as a planning midpoint rather than a guaranteed amount.
At $334 a month, utilities add roughly a third on top of the $975 median gross rent. That ratio is why the gap between housing cost and everything else deserves its own line in the budget.
Seasonality changes the mix. Air conditioning pushes electricity use during hot summers, while heating shifts more winter expense toward natural gas. The city's utilities guidance suggests reserving approximately $3,000–$4,000 annually for utilities, before transportation and taxes, as a budget allowance rather than a forecast for every property or household.
The same guidance places area commercial energy rates approximately 8.5% below the national average, and the referenced EIA data describe Kansas industrial delivered natural-gas costs as among the country's lowest. Those comparisons describe wholesale conditions, not a residential bill: a drafty house with an aging HVAC system can still outspend an efficient apartment.
Don't compare advertised rent in isolation. Ask for utility history for the actual unit or home, especially if you're comparing different building sizes or HVAC systems.
Groceries and transportation resist a single Wichita figure for a different reason: they scale with the household, not the city. A single renter's food spending differs from a family of four's, and no published city figure sets a per-person grocery amount. The workable approach is to budget food from your own current receipts, then adjust for the number of people in the household.
Transportation follows the same logic. The cost driver is the miles between home, work, and school, so two households paying identical rent can carry very different monthly totals. Price the commute for each candidate address, including fuel, insurance, and maintenance, before treating a lower rent as a lower cost of living.
How Wichita Cost of Living Shifts by Household Profile
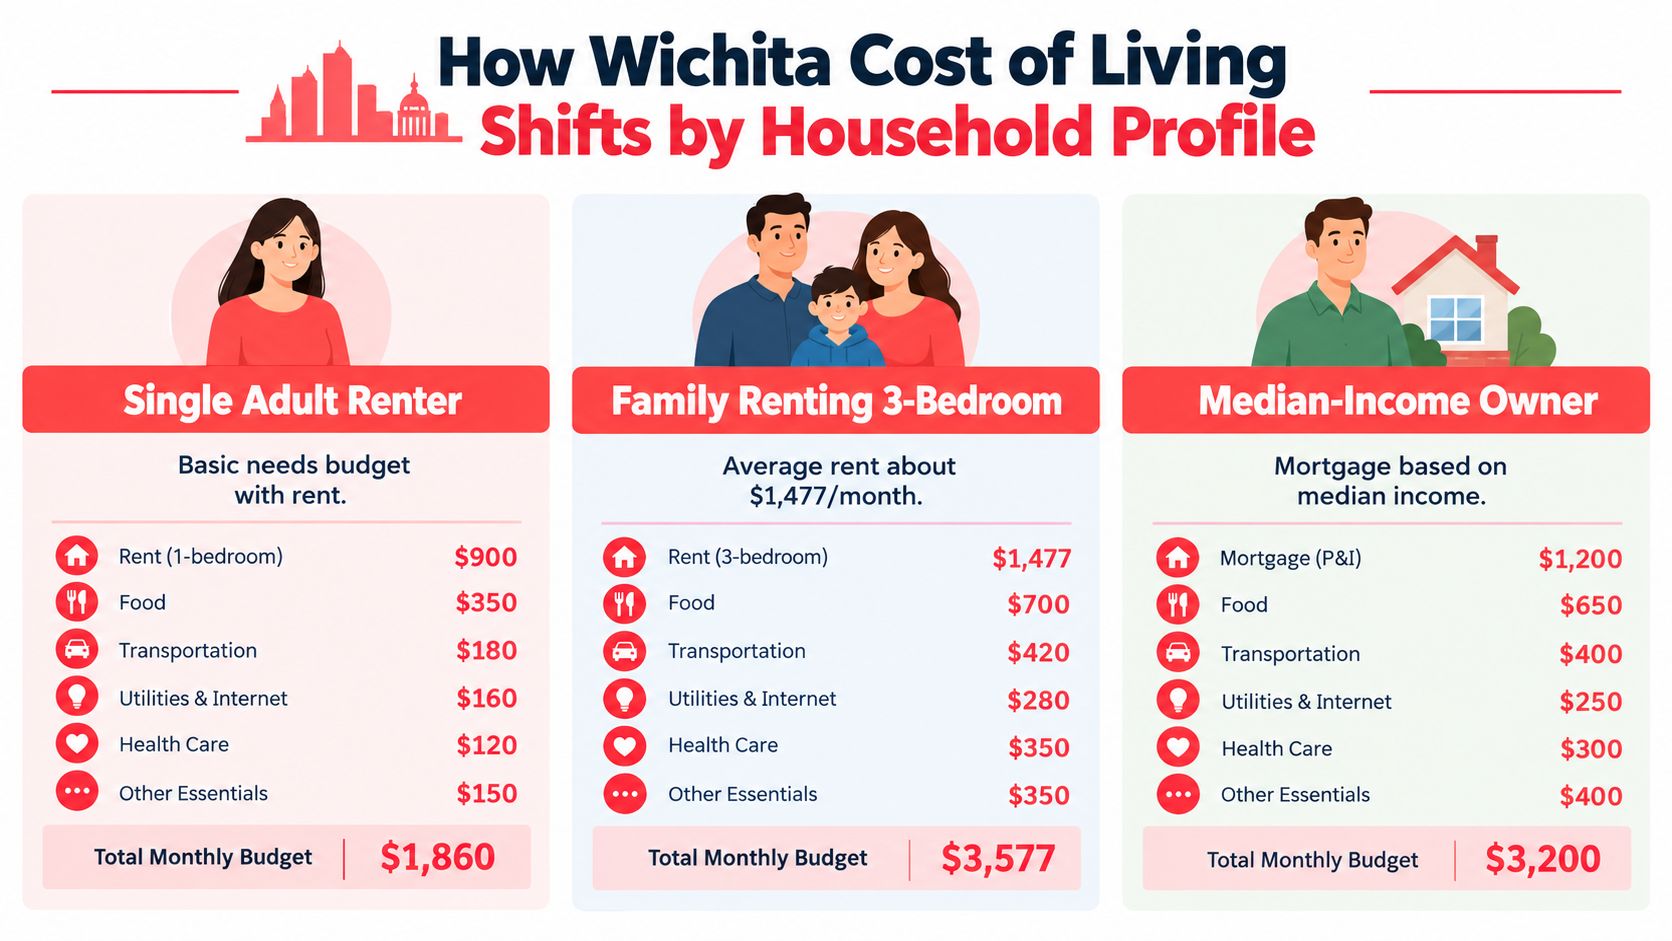
One citywide index hides the split that matters: in Wichita, the housing line diverges sharply by household type while every other cost scales with household size. The three profiles below use published benchmarks to bound the housing share of each budget. Childcare, groceries, healthcare, car insurance, and household-specific taxes lack consistent public figures, so each household has to price those from its own circumstances.
Single adult renter
The MIT estimate cited earlier puts a basic-needs wage for a single adult at $20.78 an hour, or roughly $43,222 gross per year at full-time hours. Set that against the Census QuickFacts median gross rent cited earlier, $975 a month, and the arithmetic is tight: rent alone absorbs about 27% of gross income before utilities, taxes, transport, or food enter the ledger. The threshold clears on paper. The remaining margin is the actual budget, and it shrinks quickly if rent renews higher while pay holds flat.
Family renting a house
One estimate places average rent for a Wichita house at about $1,477 a month, against an $853 average apartment rent reported in the same source (Apartments.com Wichita cost-of-living estimates). The difference, roughly $624 a month, is the published price of extra bedrooms and a yard. The figure averages houses of all sizes, so a three-bedroom may price differently, and it lands before childcare, school costs, and a larger grocery total.
Owner with a mortgage
Census owner-cost estimates put monthly costs with a mortgage at $1,480, nearly identical to the average house-rent figure. That near-parity is easy to misread. The owner measure covers selected ownership costs, and a homeowner still carries maintenance, insurance, and address-specific charges outside it. In Wichita the rent-versus-own difference sits in those surrounding costs, since the headline payments almost match.
Taxes shift the comparison again. Wichita's 7.5% combined sales-tax rate consists of the state rate and the Sedgwick County rate, with the city's listed additional rate at 0%. A household spending $3,000 a month on taxable goods would pay about $225 in sales tax, before exemptions or non-taxable items. The city estimates residential property taxes at approximately 1.34% of home value; applied mechanically to a $190,800 home, that works out to roughly $213 monthly, though an actual bill depends on assessed value, exemptions, and local taxing jurisdictions (City of Wichita tax information).
Reading Neighborhood-Level Cost Signals in Wichita
Citywide medians can tell you what a broad market looks like, but they can't tell you what an address will cost your household. A rental near a job corridor may save travel time, while a lower advertised rent farther away may come with a longer commute or different access to everyday services. The relevant comparison is the full housing-and-commute arrangement, not a neighborhood label on its own.
Use a short list of address-level questions when comparing options:
- Work and commute: Map the route to your actual workplace, including the corridors serving employers such as Spirit AeroSystems or the Air Force base. A household working remotely most days should still consider occasional office travel and errands.
- School and space needs: If school location or a larger home matters, compare the specific areas that meet those needs. Citywide averages won't reveal whether a property's location fits your household.
- Ownership mix: Wichita's owner-occupancy rate is 58.9%, meaning a majority of occupied homes are owner-occupied. That citywide figure is context, not a neighborhood-level estimate or a guide to what a particular block will cost (U.S. Census Bureau QuickFacts for Wichita).
- Total monthly exposure: Check rent or mortgage alongside utilities, taxes, insurance, and likely travel costs. A low asking price can lose its advantage if the property needs more upkeep or increases your commute.
An address is the useful unit of comparison. Two homes that share a city label can have different expenses, travel patterns, and household tradeoffs.
For movers, the next layer of research is to compare actual listings with local context, rather than assume a citywide cost figure applies evenly. Look at the property, the commute, and the neighborhood together. That approach also keeps claims about “premium” areas or rent differences grounded in the specific options you're weighing, instead of assuming every school zone or job corridor carries the same cost.
Is Wichita Still Affordable or Just Inexpensive for Now
Wichita's affordability depends on which year you measure. The city policy message projected 8.0% home-price growth for 2025, while nominal personal income was projected to grow 4.3% in 2025 and 4.1% in 2026, meaning prices were expected to outpace pay within the same period (City of Wichita policy message). On the rental side, the same materials reported a 2.2% rent increase over the preceding year, roughly $20 more per month. These are projections and reported trends, not guarantees about future prices or wages.
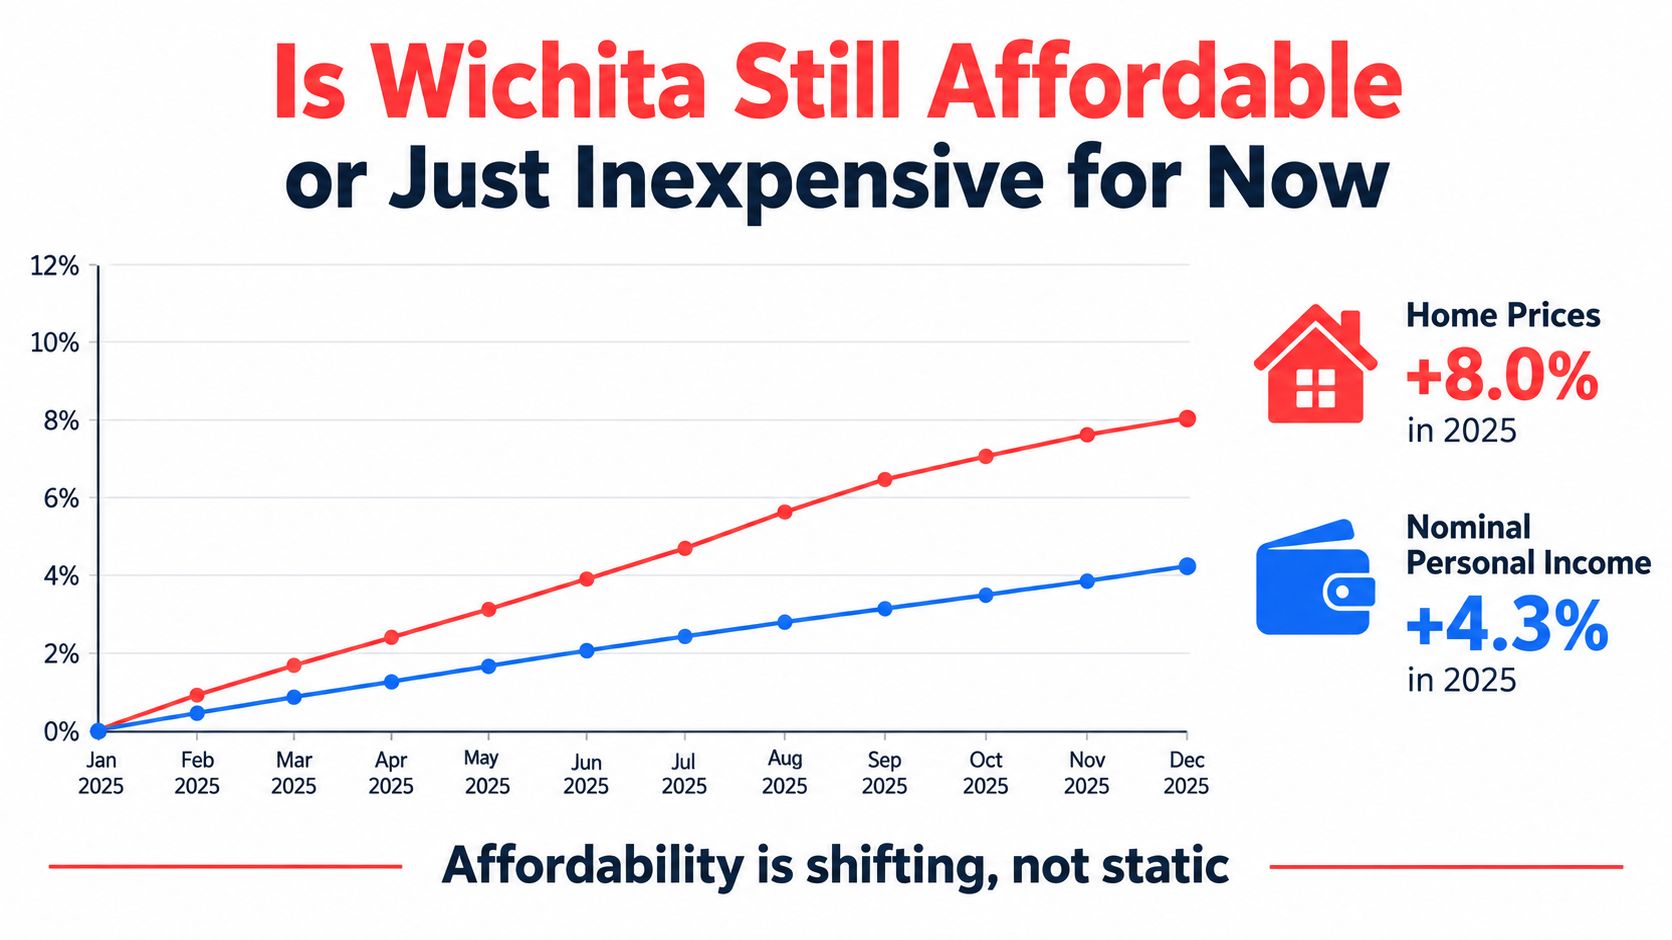
That gap between price growth and income growth is the affordability test. A city can stay cheaper than national benchmarks while still getting harder to afford for the people already living in it.
The pressure lands unevenly by household profile. A buyer near their borrowing limit loses purchasing power each year prices outrun pay, even if Wichita stays below the national median. A renter absorbing a modest dollar increase feels it differently depending on earnings, since $20 a month matters more on a service or logistics wage than on an engineer's salary. Entry-level and lower-paid workers should test the budget against their own expected income rather than assume the city median represents them.
A household arriving with a higher salary may still find Wichita housing attainable. A household whose earnings lag local price growth faces tighter choices. To check the income side of your plan, estimate your pay and compare that figure with the actual listings you're weighing. Treat every forward-looking number as a scenario to test.
A sound relocation plan models the intended time horizon, not just move-in costs. Compare today's expenses with the possibility that housing keeps outpacing wages, and include taxes, insurance, utilities, and commuting. For a wider shortlist, benchmark Wichita against other affordable places to live in the Midwest using the same household budget each time.
A Wichita Affordability Checklist for Prospective Movers
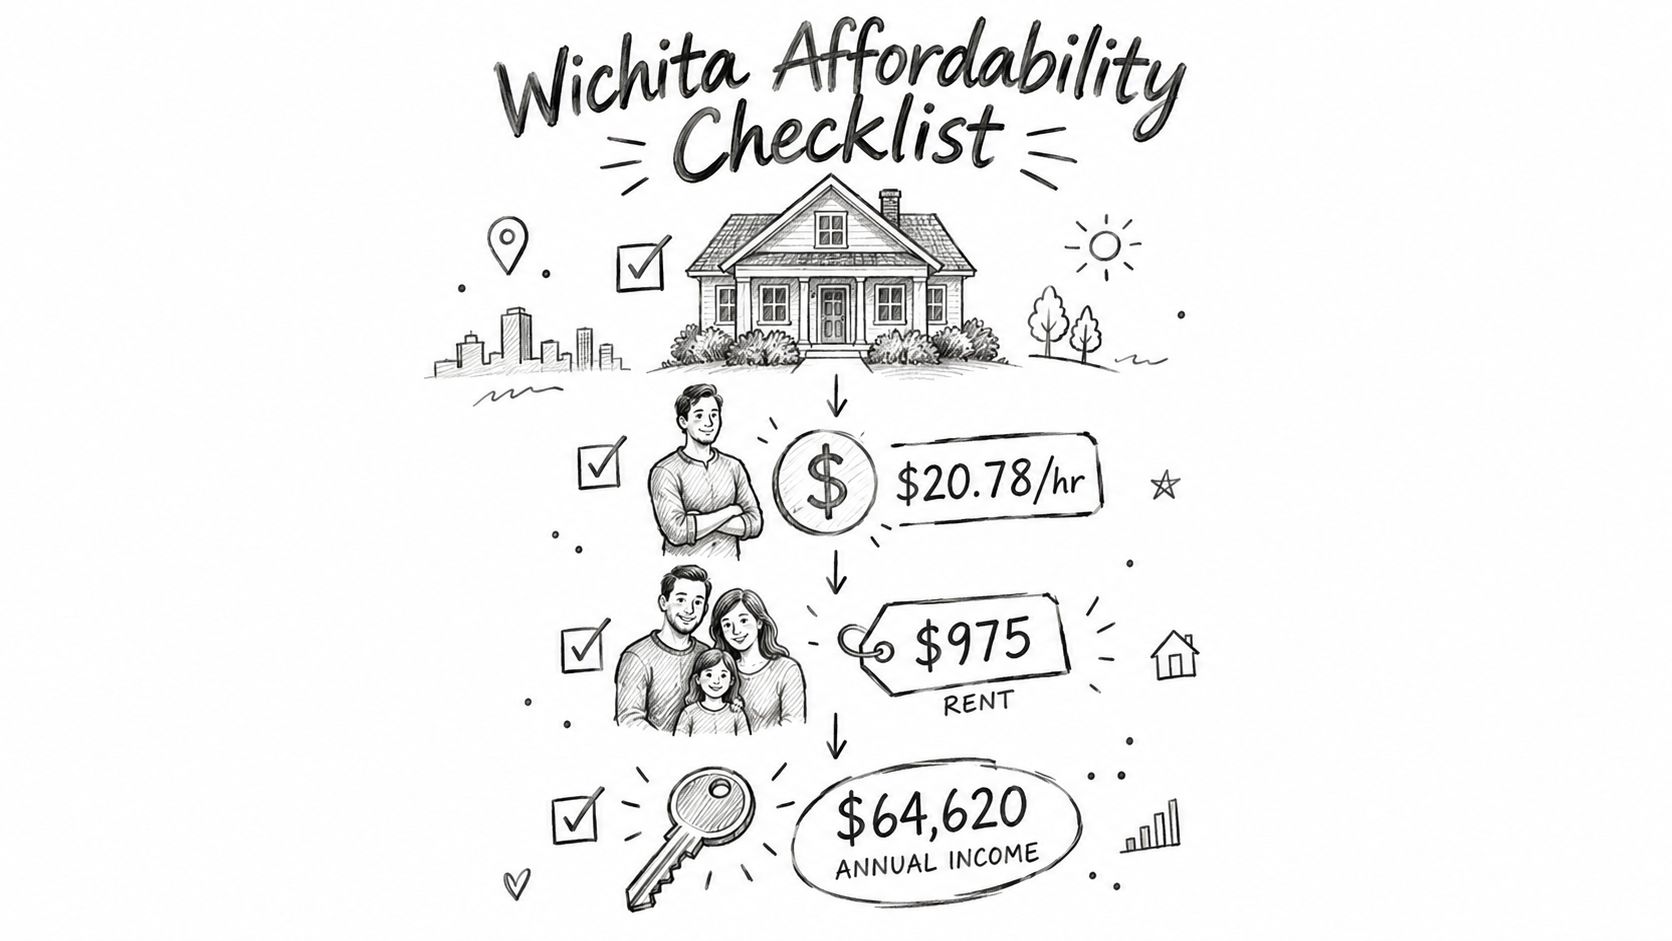
Before you sign a lease or make an offer, work through the budget in this order:
- Match the household profile. Use a single-adult baseline only if it fits your household. Children, housing needs, and income sources change the calculation.
- Set an income floor. Compare expected gross income with MIT's living-wage benchmark, then account for taxes and expenses the benchmark doesn't cover.
- Test the housing payment. Compare rent or ownership costs with your income, and distinguish the city median from the quote for a specific property.
- Add recurring costs. Include utilities, sales tax on taxable purchases, property tax if you'll own, and transportation. For first-time renters, a guide to budgeting your first apartment costs can help organize move-in and recurring expenses.
- Check the trend, not just the snapshot. Review rent and home-price signals against projected income growth before committing to a longer-term plan.
Wichita's cost advantage is strongest in housing, not every category of spending. A citywide ratio can orient your search, but the decision should come from a realistic household budget and the exact address. If you're comparing another Kansas city, Topeka, Kansas offers a useful reference point for a broader location comparison.
Frequently Asked Questions
What rent share becomes financially stressful at Wichita incomes?
Rent becomes a heavier burden as it takes a larger share of gross household income, and the same rent can affect households very differently. At $40,000 in annual income, $975 monthly rent would equal about 29.3% of gross income. At $30,000, it reaches 39%. These are illustrative calculations using city median rent, so treat them as stress tests rather than a universal affordability cutoff or a quote for a specific property (U.S. Census Bureau QuickFacts for Wichita).
What recurring costs can surprise someone who has budgeted only for rent?
Utilities, sales tax on taxable purchases, and transportation can all add costs beyond rent. Buyers should check the property-specific tax estimate rather than assume a citywide rate will produce their exact bill. Car insurance varies by driver and vehicle, and no uniform Wichita figure is available here, so get a quote for your own circumstances.
What does Wichita's affordability outlook look like for 2026?
The cited income projection for 2026 is 4.1% nominal growth, while the city policy message cited above also projected home-price growth of 8.0% for 2025. Neither figure establishes what prices or wages will do in 2026. Taken together, though, they make it prudent to test a move against more than one budget scenario.
Which household may benefit most from Wichita's current cost structure?
A household able to use relatively lower-cost housing without adding major space or commute requirements is best positioned to benefit. Families needing a house, more bedrooms, or a particular location should compare the specific rent and travel costs, because citywide apartment averages may not represent their options.
Compare Wichita locations using the household costs that matter to your move, from housing and neighborhood context to safety, commute, and quality of life. Visit ReloMaps to explore locations and build a more informed shortlist.
Enjoying the blog? Subscribe to ReloMaps+ for premium area intelligence — and to keep us independent.
Subscribe today