Cost of Living in Nebraska Lincoln: A 2026 Guide

Lincoln's overall cost of living is roughly 6% to 8% below the U.S. average, driven mainly by housing that runs about 22% to 23% below national figures. That advantage can narrow for homeowners, because Nebraska property taxes and a 5.5% state sales-and-use tax add costs that a single citywide index doesn't show.
The practical answer to the cost of living in Nebraska Lincoln is that housing is cheaper than the national benchmark, but Lincoln isn't uniformly inexpensive. Housing supplies most of the savings, while groceries and transportation sit much closer to national pricing, and ownership costs can look very different from rent once taxes, insurance, utilities, and maintenance enter the calculation.
Table of Contents
- What Cost of Living Actually Means in Lincoln
- Housing Prices and the Real Cost of Getting In
- Taxes in Nebraska That Change the Math
- Utilities, Groceries, and Transportation Day to Day
- Neighborhood-Level Cost Dispersion Inside Lincoln
- How Lincoln Compares to Peer Midwest Cities
- Using ReloMaps Filters to Pressure-Test a Lincoln Move
- Frequently Asked Questions
What Cost of Living Actually Means in Lincoln
Lincoln's overall cost of living is commonly estimated at 6% to 8% below the U.S. average, but homeowners and renters experience that difference in noticeably different ways. Renters may benefit from lower headline housing costs, while owners must account for Nebraska's recurring property-tax burden, insurance, maintenance, and financing costs.
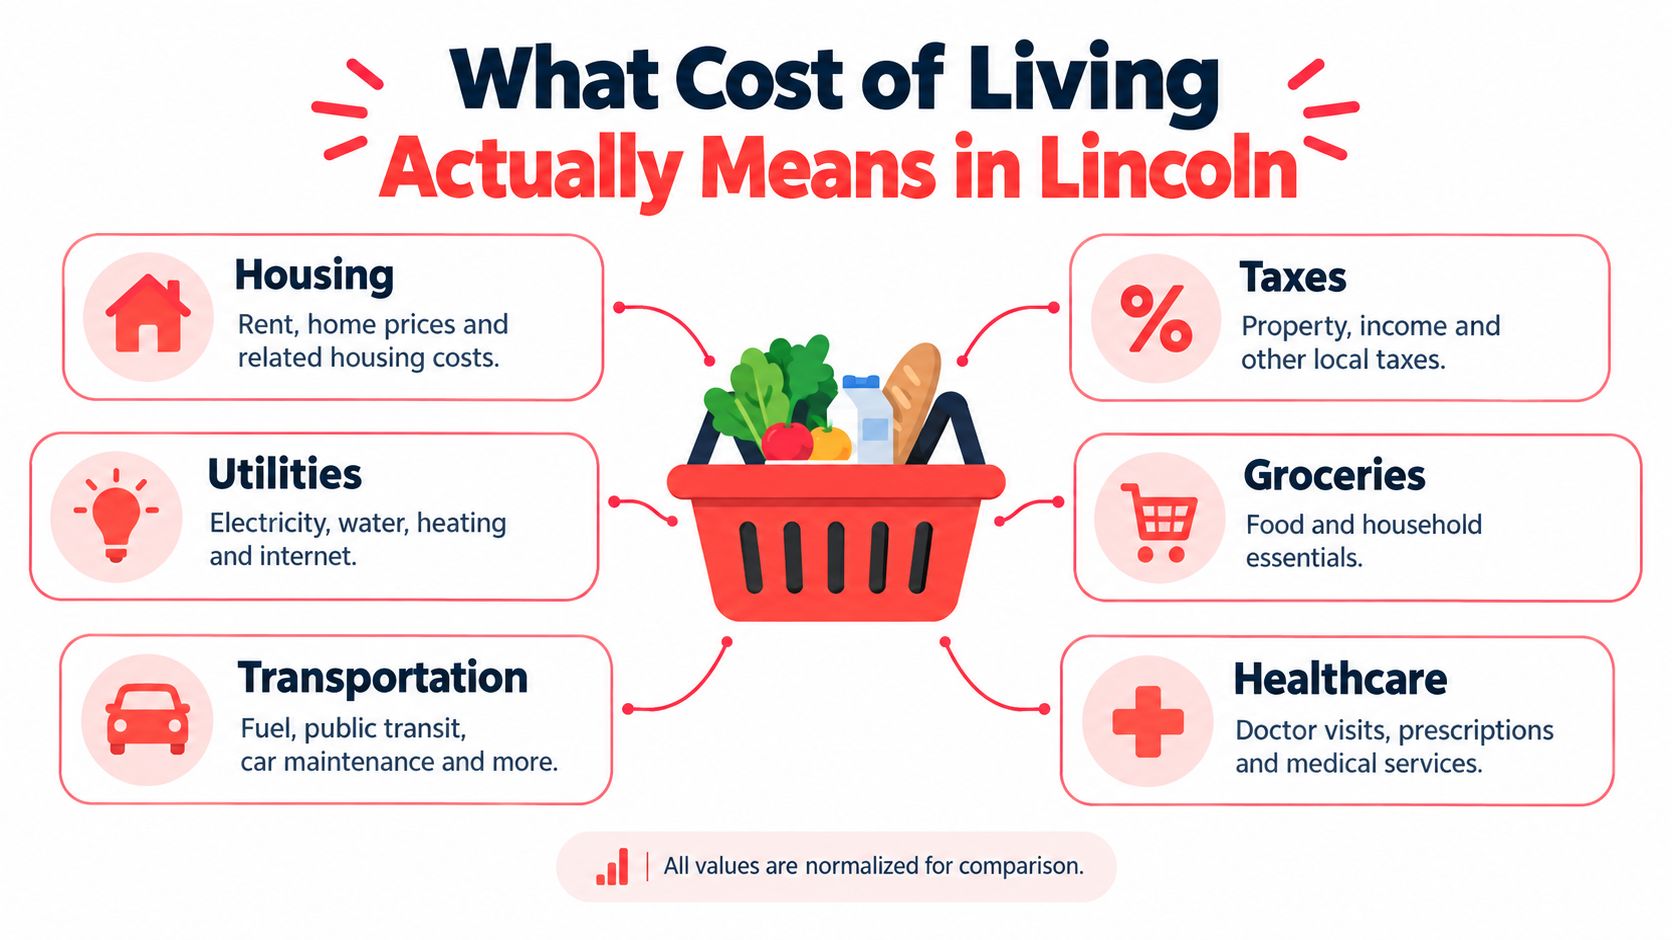
A useful relocation budget treats cost of living as a household-weighted basket, not a single score. The basket includes housing, taxes, utilities, groceries, transportation, and healthcare, with each category normalized against a national or local comparison base. That distinction matters because Lincoln's housing costs are about 22.8% below the national average, while groceries are only 1.5% lower, utilities are 6.1% lower, and transportation is 4.8% lower, according to the Lincoln cost profile from Apartments.com.
Start with the household, not the index
A single national index assumes an average spending pattern. Your household may not resemble that average. A remote worker with one vehicle and a modest rental can capture more of Lincoln's housing advantage than a family buying a larger home, commuting in two cars, and using significant winter heating.
Use this sequence when estimating your own budget:
- Set the tenure: Compare a new lease with the full monthly cost of ownership, not rent with a mortgage payment alone.
- Choose the neighborhood: Citywide medians conceal meaningful differences between ZIP Codes and housing types.
- Add taxes: Property tax affects owners directly, while sales tax affects furniture, appliances, vehicles, and other taxable purchases.
- Model seasonal expenses: Heating and electricity can shift the monthly budget even when annual utility comparisons look favorable.
- Test residual income: Subtract housing, utilities, transportation, taxes, and healthcare from take-home income.
Lincoln's citywide profile is a useful starting point, but the Lincoln location profile should be treated as orientation rather than a final affordability verdict. The strongest relocation decision comes from matching the city's cost pattern to your tenure, income, household size, vehicle needs, and preferred neighborhood.
Practical rule: If housing is your largest expense, Lincoln's headline advantage may be meaningful. If taxes, commuting, or winter energy use dominate your budget, the citywide index may overstate your actual savings.
Housing Prices and the Real Cost of Getting In
Lincoln's housing numbers look favorable at first glance, but monthly affordability changes fast once you separate citywide medians from the rent-or-own decision. Census-based estimates for 2020–2024 put Lincoln's median owner-occupied home value at approximately $264,000, compared with a reported U.S. median of $332,700. Median gross rent is approximately $1,086 per month, versus $1,413 nationally. The same source places Lincoln's median home-value-to-household-income ratio at about 3.7, compared with 4.1 nationally, according to Census-based Lincoln housing estimates.
| Indicator | Lincoln | U.S. / Nebraska benchmark |
|---|---|---|
| Median owner-occupied home value | Approximately $264,000 | U.S. median $332,700 |
| Median gross rent | Approximately $1,086 per month | U.S. median $1,413 per month |
| Home-value-to-household-income ratio | About 3.7 | U.S. ratio 4.1 |
| Housing comparison | Below the national benchmark | About 15.5% above Nebraska's statewide average |
The statewide comparison is where some movers get surprised. Lincoln is reported as about 15.5% more expensive than Nebraska's statewide average, and recommended minimum annual income estimates are approximately $32,000 for a single adult and $50,400 for a family, according to Lincoln's cost comparison from BestPlaces. For someone arriving from a high-cost metro, that can still feel manageable. For a household coming from a smaller Nebraska town, the savings may be modest or absent.
Rent is cheaper, but affordability still breaks down
Headline medians also hide who gets squeezed. Lincoln reports 47.2% of renters as housing-cost burdened, meaning they spend at least 30% of household income on housing, compared with 21.4% for homeowners with a mortgage and 10.6% for owners without one. That pattern matters more than the citywide average because it shows how often lower nominal housing costs still overrun a working household budget.
I would treat that as a budgeting warning, not a contradiction. A city can post below-national housing costs and still be difficult for renters if wages, lease timing, unit quality, commute costs, or household size push the actual payment above the median.
The rent-versus-buy spread is also narrower than many buyers expect. One Lincoln comparison cited ownership costs of about $1,246 per month, including mortgage-related costs and property taxes, versus approximately $1,052 for a two-bedroom rental, a difference of $194 per month, as reported by Lincoln's cost comparison from BestPlaces. That is useful as an example, not as a universal payment quote.
Down payment, interest rate, homeowners insurance, maintenance, tax assessment, and expected time in the home can all change the outcome. In practice, Lincoln often works best for buyers who plan to stay long enough to absorb upfront costs, and for renters who compare neighborhoods carefully instead of assuming the city median reflects available listings.
Buying in Lincoln can make sense on paper, but the monthly decision turns on taxes, insurance, maintenance, and hold period, not the mortgage payment alone.
Taxes in Nebraska That Change the Math
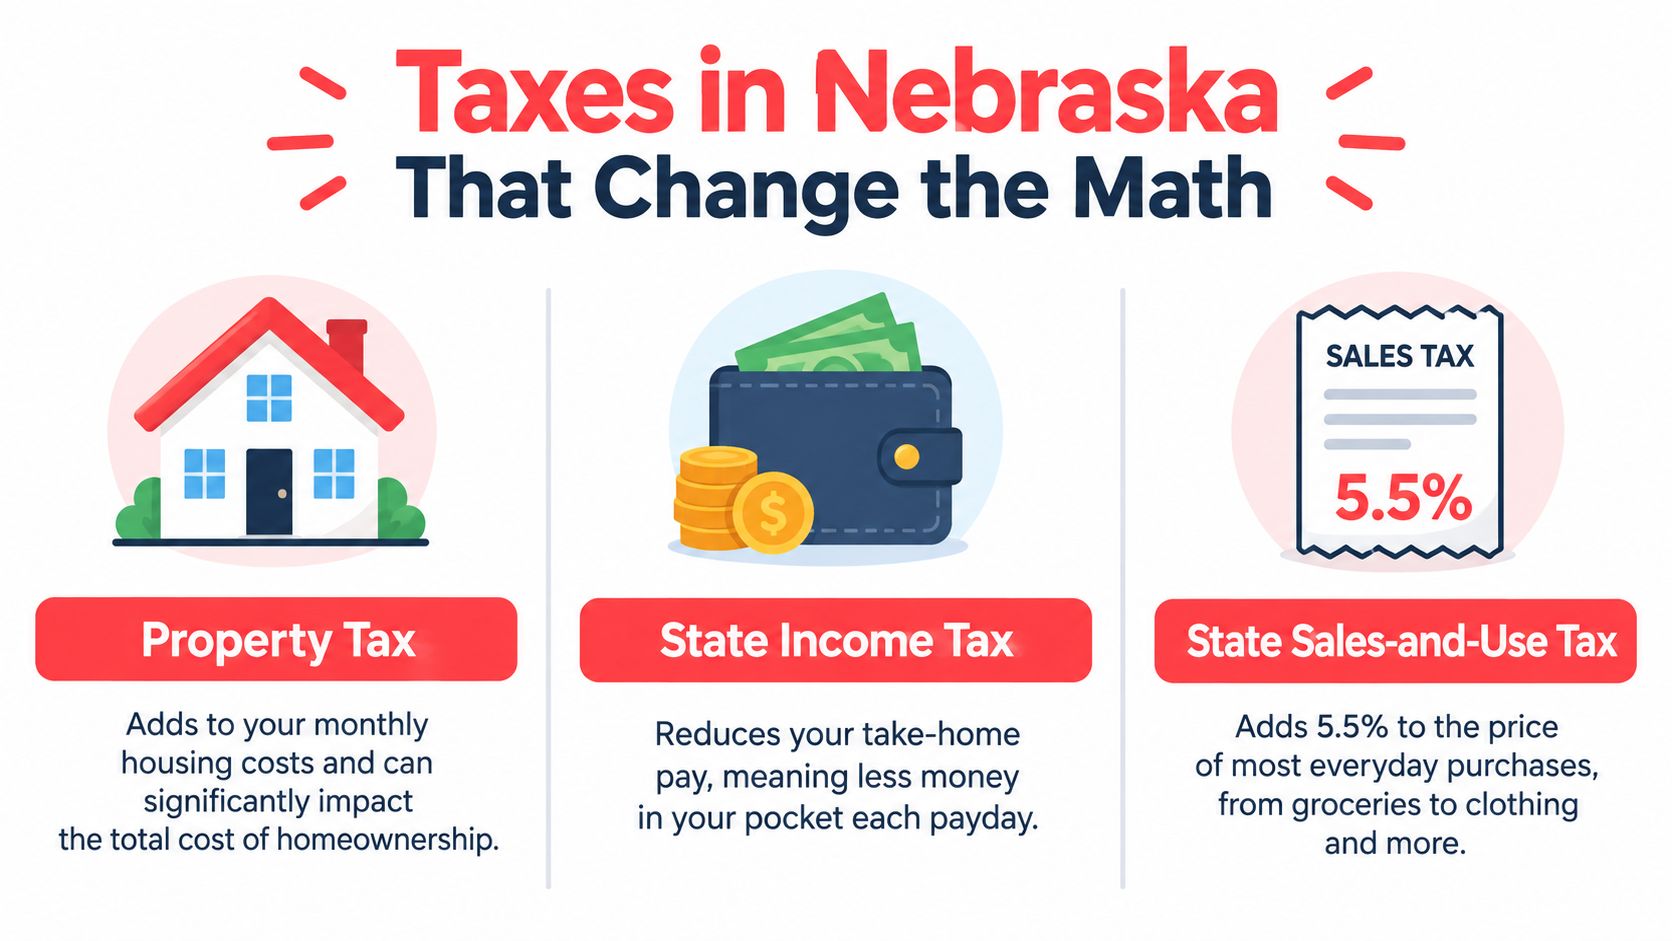
Nebraska's tax structure can reduce the savings suggested by Lincoln's housing prices. The practical mistake is to treat “taxes” as one line item. Property tax affects owners, state income tax affects take-home pay, and sales-and-use tax appears when households buy taxable goods and services.
Independent estimates place Nebraska property taxes near 1.47% to 1.58% of assessed value, with an estimated annual bill of roughly $2,662 to $2,788 on a median-priced home. The state sales-and-use tax rate is 5.5% before applicable local city or county additions, according to the Nebraska Department of Revenue's sales-and-use tax guidance.
Property tax belongs in the monthly payment
An annual property-tax bill of $2,662 to $2,788 works out to roughly $222 to $232 per month before considering changes in assessment or the property's actual tax treatment. That amount can materially narrow the difference between renting and buying, particularly for buyers with a small down payment or a short expected holding period.
The assessment also matters. A buyer shouldn't use a citywide median as a substitute for a parcel-specific tax estimate. Two homes with similar purchase prices can produce different monthly obligations if their assessments, districts, exemptions, insurance costs, or maintenance needs differ.
Sales tax appears during the move
The 5.5% state sales-and-use tax applies before local additions and can affect furniture, appliances, taxable vehicle purchases, and contractor-supplied materials. A household furnishing a home can therefore face a meaningful move-in tax bill even if its ongoing rent or mortgage payment fits the plan.
State income tax belongs in the take-home-pay calculation as well, but the effect depends on income, filing status, deductions, and other personal circumstances. It shouldn't be collapsed into a generic “Lincoln is cheaper” claim.
Use the Nebraska tax overview as a reminder to separate ownership, income, and consumption taxes when comparing locations. The following video provides additional context for thinking about the broader tax picture.
Utilities, Groceries, and Transportation Day to Day
Everyday spending is where Lincoln's headline affordability advantage becomes less dramatic. Housing is the main source of savings, while groceries, utilities, and transportation are closer to national norms. Apartments.com estimates groceries at about 1.5% below the national average, utilities at about 6.1% below, and transportation at about 4.8% below. Those differences can help, but they usually won't compensate for a poor housing or commute decision.
One estimate places Lincoln's median household income near $69,991, metro median wages around $49,800, and electricity at about 13.3 cents per kilowatt-hour. A separate estimate places utilities approximately 23.2% below the national average, according to Lincoln income and utility comparisons. The gap between utility estimates shows why a household should use its own home size, heating system, occupancy, and billing history when possible.
Winter changes the monthly pattern
An annual average can conceal the months that strain a budget. Lincoln households need to plan for seasonal heating demand, particularly in detached homes with more exterior exposure or less efficient systems. A renter comparing apartments should ask for recent utility bills, identify whether heat is electric or gas, and confirm which services are included in rent.
For a repeatable estimate, review utility cost estimation methods from Unitism®. The useful output isn't a false sense of precision. It's a range that separates base usage from seasonal swings and clarifies which utilities the tenant or owner pays.
Transportation depends on the household pattern
A remote worker who drives infrequently may experience Lincoln's transportation costs differently from a two-car household with two daily commutes. A shorter commute can reduce fuel and vehicle wear, but a household that chooses a less expensive home far from work may give those savings back through regular driving.
Groceries sit close to national pricing, so store choice, household size, and shopping habits matter more than the citywide average. The best budget assigns a realistic monthly amount to food and then focuses attention on the categories with larger household-specific variation, especially housing, taxes, vehicles, and winter utilities.
Neighborhood-Level Cost Dispersion Inside Lincoln
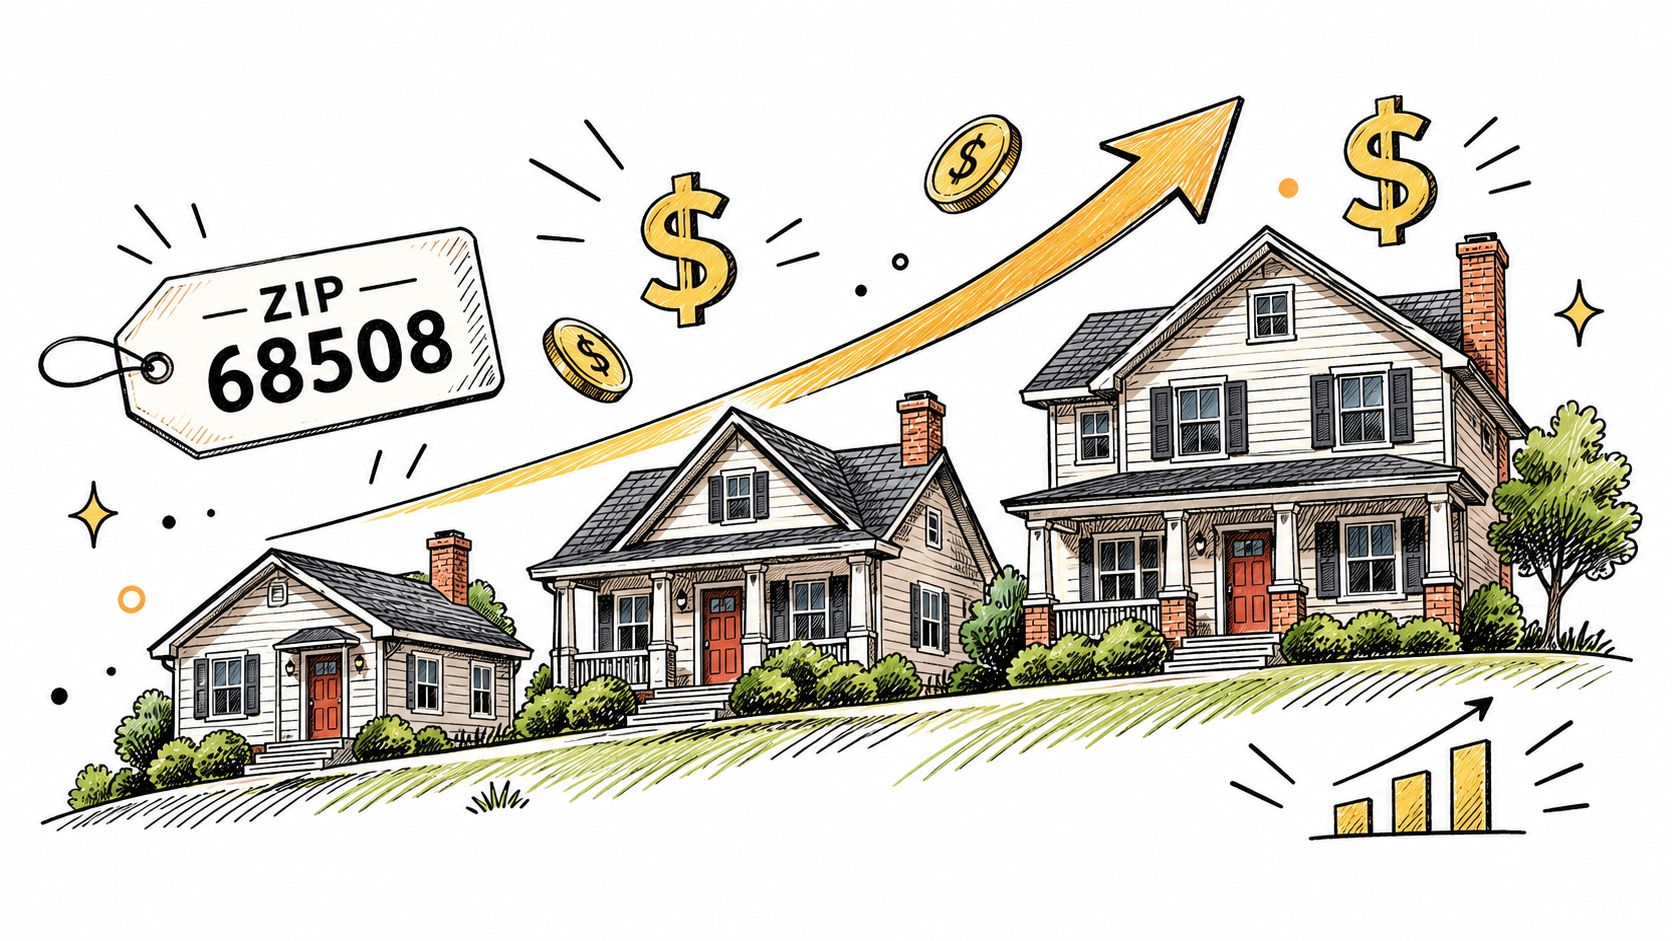
Lincoln's citywide median doesn't tell you what it costs to enter every part of the market. Two ZIP Codes provide a clear teaching example. In 68512, the 2024 median home value was $322,400, up $132,200, or 69.51%, from 2011. Median gross rent reached $1,251, up $465, or 59.16%.
In 68510, the 2024 median home value was $239,700, an increase of $103,000, or 75.35%, since 2011. Median gross rent was $892, up $311, or 53.53%. These figures come from the ZIP Code housing data for 68512.
The entry-cost gap is large inside one city
The difference between these ZIP Codes is $82,700 in median home value and $359 per month in median gross rent. For a renter, $359 per month affects cash flow immediately. For a buyer, the higher purchase price can also increase the required down payment, loan amount, property tax, insurance, and maintenance exposure.
The appreciation pattern complicates the story. Both areas experienced substantial long-term growth, but 68510's reported percentage increase was higher despite its lower 2024 median. That means today's cheaper ZIP Code isn't necessarily a place where housing costs have stood still.
Use appreciation as context, not a forecast
Historical appreciation helps identify how quickly entry costs have changed. It doesn't guarantee future returns or prove that one ZIP Code will outperform another. A household should combine price history with current rent, property condition, commute, taxes, insurance, and the length of time it expects to stay.
The practical lesson is simple: a citywide affordability label can hide neighborhood-level pressure. Renters should compare actual lease options, while buyers should evaluate the full monthly payment for a specific property rather than assuming the city median describes the neighborhood they want.
How Lincoln Compares to Peer Midwest Cities
A single citywide index can hide the difference that changes a monthly budget. Lincoln often looks competitive on the headline number, but renter versus owner math, local tax exposure, and winter utility swings can narrow the gap fast.
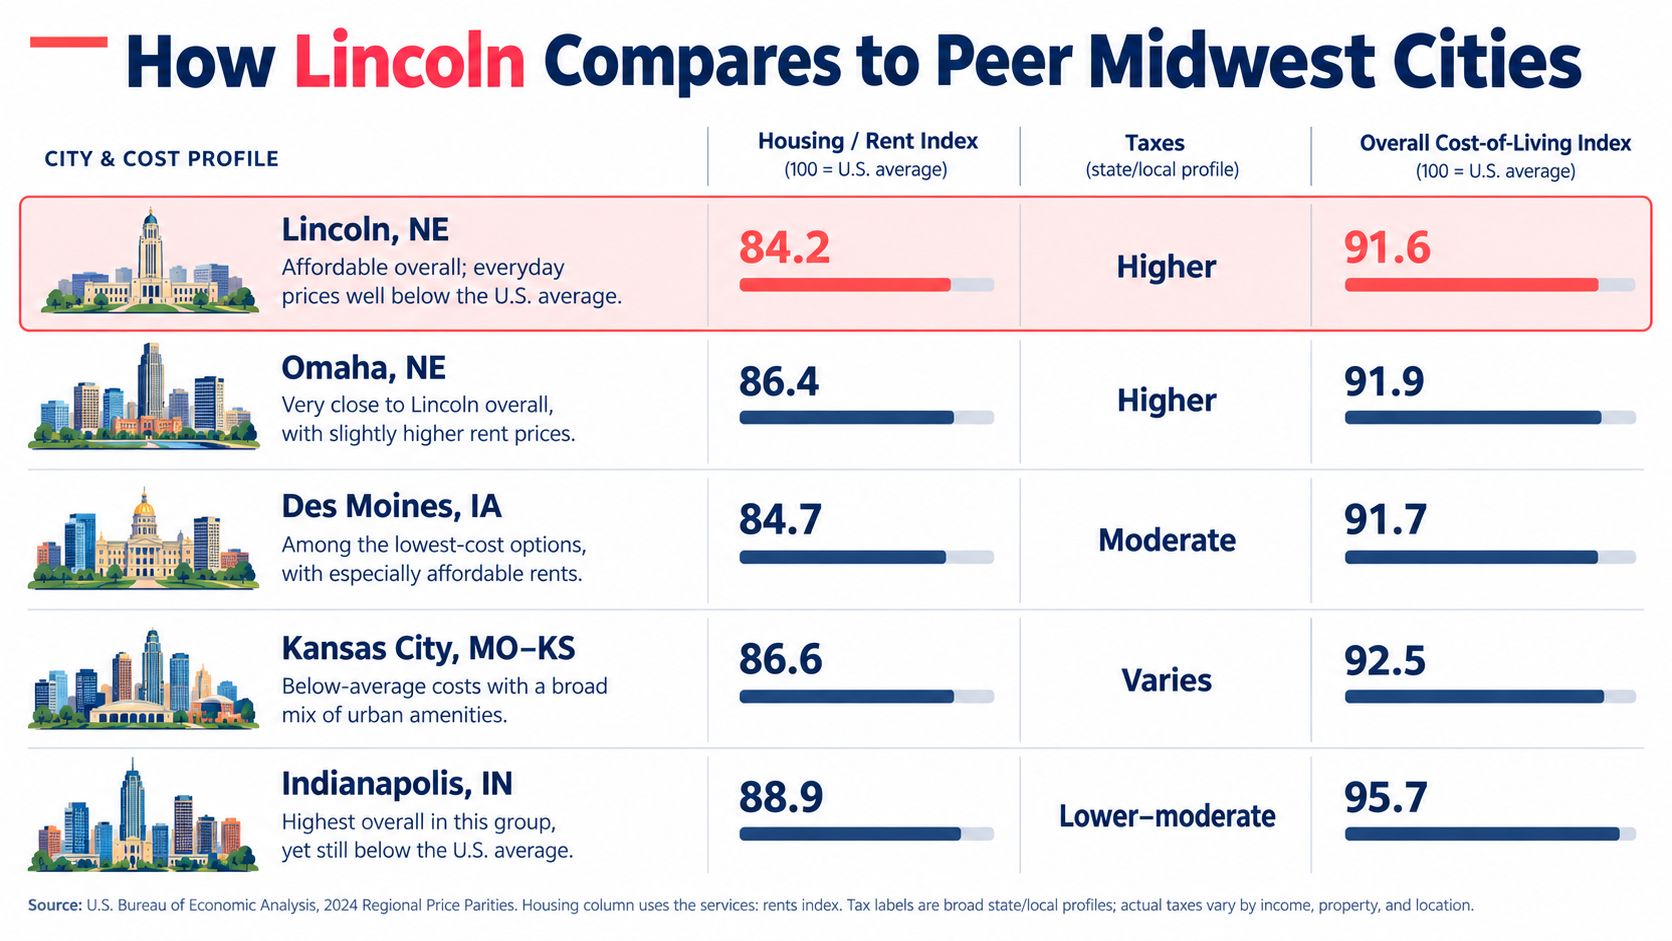
The peer-city view is more useful than a statewide comparison because households choosing Lincoln are often also weighing Omaha, Des Moines, Kansas City, or Indianapolis. The right question is not which city has the lowest label. It is which city leaves the better month-end margin after housing, taxes, transportation, and utilities are matched to the same lifestyle. The A comparative infographic showing the cost of living indices for Lincoln, NE and peer Midwest cities. illustrates that Lincoln sits in a familiar Midwest band rather than in a dramatically cheaper tier.
Compare the budget categories, not just the city labels
| City | Housing entry point | Taxes | Utilities and transport |
|---|---|---|---|
| Lincoln | Usually favorable versus larger Midwest metros, but buyer math can tighten once ownership costs are included | Nebraska property tax can erode a low purchase price | Seasonal heating and car dependence matter more than the headline index suggests |
| Omaha | Broader housing market, but savings depend heavily on neighborhood and commute | Nebraska tax structure still applies | Similar weather profile, with commute pattern affecting fuel costs |
| Des Moines | Often a close substitute for households prioritizing stability over headline bargains | Tax mix changes the comparison even when housing looks similar | Utility and driving costs can keep monthly totals close |
| Kansas City | Larger-market housing options can look attractive at first glance | Cross-state differences make tax math scenario-specific | Longer drives can offset nominal housing savings |
| Indianapolis | Often compared on affordability, but metro size changes commute and neighborhood spread | Ownership costs need full monthly review, not sticker-price review | Transportation trade-offs are more important than a citywide average |
For renters, Lincoln can hold up well if the comparison city requires a longer commute, higher parking costs, or a second car. For buyers, the picture is less forgiving. A lower home price does not automatically produce a lower payment once property tax, insurance, and maintenance are added.
That is the practical distinction. Lincoln is often cheaper on the broad index than many households expect, but it is not uniformly cheap across living situations. The fair comparison is scenario-based: one-bedroom renter, two-bedroom family renter, first-time buyer, or trade-up homeowner. Without that separation, peer-city rankings flatten the very costs that decide whether a move works.
Using ReloMaps Filters to Pressure-Test a Lincoln Move
A Lincoln relocation shortlist should begin with the costs most likely to break your budget, not with a general affordability label. Start by defining your household profile: renter or buyer, income level, number of vehicles, work location, commute tolerance, and whether winter utility variation matters.
On ReloMaps Explore, use filters to isolate the trade-offs that a citywide index compresses:
- Begin with rent burden or home values: Remove places that fail your basic monthly or purchase-price threshold.
- Add taxes and utility bands: Test whether the apparent housing savings survive recurring ownership and energy costs.
- Filter commute time and work-from-home rate: A lower-cost neighborhood may be a poor fit if it requires a second vehicle or a long daily drive.
- Use homeownership and rent filters: Keep renter and buyer scenarios separate instead of averaging them together.
- Compare category grades: Examine economics, quality of life, safety, and strategic location alongside cost.
The workflow works because it turns affordability into a constraint problem. A remote worker may prioritize rent, utilities, and neighborhood quality. A family buyer may put taxes, home values, commute, and ownership rates first. A retiree may need to examine property taxes and healthcare access more closely than wage data.
Use the filters to create a shortlist, then verify any final property with parcel-specific taxes, insurance quotes, utility history, and a realistic transportation budget. The platform can organize local context, but your final decision still depends on the household numbers that a citywide score can't know.
Frequently Asked Questions
Is buying in Lincoln only slightly more expensive than renting after property taxes?
That depends less on a citywide average and more on how you finance the purchase. A buyer putting 20% down will face a very different monthly payment than a buyer putting 5% down, even before insurance, maintenance, and Lincoln's property tax burden enter the picture. I usually separate the decision into two tests: the all-in monthly payment, and how long you expect to stay. If you may move again within a few years, closing costs, repairs, and resale friction can erase the apparent advantage of owning even when the headline payment looks close to rent.
What hidden relocation costs should I budget for in Lincoln?
Budget the move in layers, not as one lump sum. Utility deposits, renter's insurance, vehicle registration, parking, basic winterization items, and move-in purchases often land in the same first-month window. Nebraska's 5.5% state sales-and-use tax, before local additions, matters here because furniture, appliances, and many home setup purchases are taxed. For homeowners, add immediate setup costs such as tools, blinds, lawn care equipment, or contractor work that do not appear in a rent comparison.
At what income does Lincoln start feeling unaffordable despite below-median rent?
Lincoln starts to feel tight when the leftover cash after fixed bills is too thin to absorb ordinary shocks. Two households with the same rent can experience the city very differently if one has a car payment, childcare, or higher health premiums. A better test than a headline affordability ratio is residual income: calculate take-home pay, subtract housing, utilities, transportation, debt, insurance, and groceries, then see what remains for savings and irregular costs. If that remainder is small, Lincoln will not feel inexpensive in practice, even if the rent looks reasonable on paper.
Should I use Lincoln's median home value or its current listing price?
Use both, but for different jobs. Zillow's Lincoln home value estimate is about $291,062, while Realtor.com's Lincoln median listing price is around $400,000. The first is a broad estimate of existing housing value. The second reflects current asking prices among active listings. For budgeting, the listing side is usually more useful if you plan to buy soon, but neither number replaces parcel-level taxes, insurance quotes, condition, and neighborhood-specific price bands.
ReloMaps helps movers compare Lincoln with other U.S. locations using city and neighborhood context across housing, taxes, safety, quality of life, demographics, and strategic location. Visit ReloMaps to pressure-test your Lincoln shortlist with household-specific filters instead of relying on a single cost-of-living number.
Enjoying the blog? Subscribe to ReloMaps+ for premium area intelligence — and to keep us independent.
Subscribe today