Climate in Cincinnati Ohio: Seasonal Weather Guide

If you're moving to Cincinnati, don't make the mistake of judging the city by a neat little “moderate Midwest” label. Climate in Cincinnati, Ohio is humid, four-season, and more disruptive than the averages suggest, with roughly 43.40 inches of annual precipitation and about 27 days a year that reach at least 90°F in the Cincinnati/Covington climate normals for 1991 to 2020 (National Weather Service climate normals for Cincinnati/Covington). What matters for a house isn't the headline average, it's how much rain falls in spring, how hard summer heat hits at night, and whether the block you want can handle water, shade, and power demand.
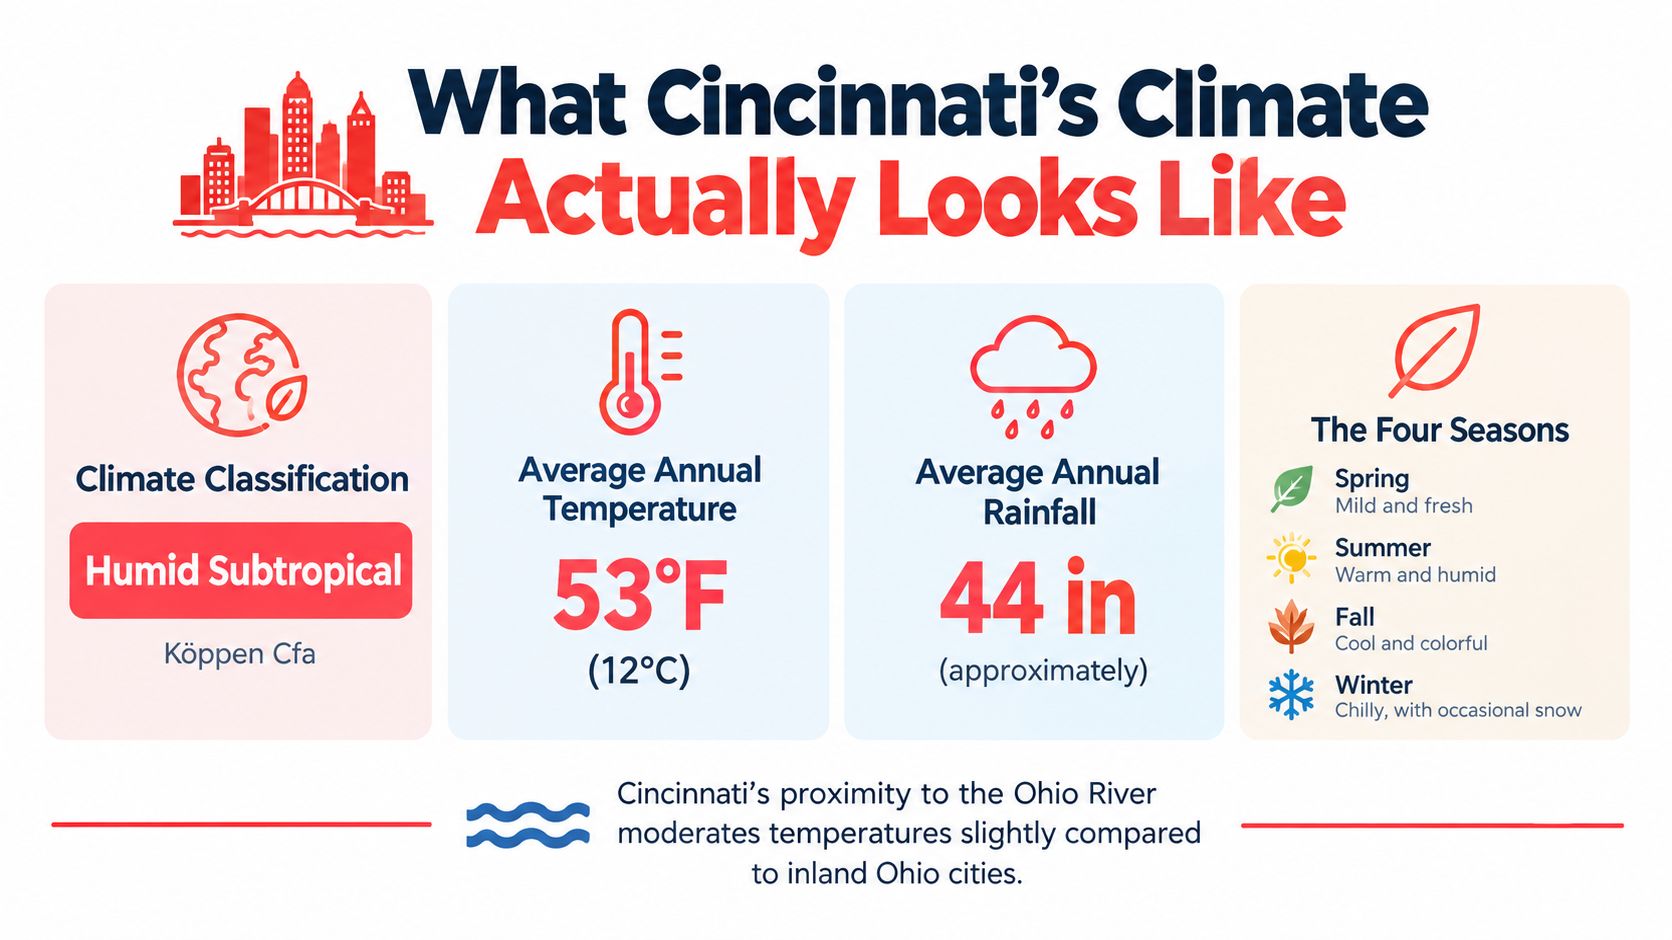
Table of Contents
- What Cincinnati's Climate Looks Like
- Where Cincinnati Sits on the Climate Map
- A Season by Season Look at Cincinnati Weather
- Why Annual Rainfall Totals Mislead Cincinnati Residents
- Ohio River Flood History and What It Means for an Address
- The Neighborhood-Level Heat Map Most Cincinnati Climate Articles Skip
- Climate as a Relocation Variable, Not a Trivia Topic
- Frequently Asked Questions About Climate in Cincinnati Ohio
What Cincinnati's Climate Looks Like
A house in Cincinnati lives with humidity, steady rain, and real seasonal swings. The city gets about 43.40 inches of precipitation a year, with monthly normals ranging from 2.79 inches in February to 4.70 inches in May (National Weather Service climate normals for Cincinnati/Covington). Rain is not a side issue here, it shapes how roofs, grading, gutters, and basements hold up.
Summer heat matters too. The same climate normals show enough warm-season pressure that cooling is a serious housing concern, especially on upper floors, in homes with weak insulation, and on lots with little shade. Winter is usually workable rather than severe, but Cincinnati sits near the southern edge of the humid continental zone and close to the humid subtropical transition, so cold spells still show up and mild averages can hide uncomfortable swings.
Judge a Cincinnati home by how it handles water, heat, and airflow.
That is where neighborhood context changes the story. A block on higher ground with mature trees will feel very different from a lower-lying street that traps runoff, bakes in afternoon sun, or sits closer to flood-prone corridors. The citywide average is useful, but it does not tell you whether a specific address will stay dry after hard rain or stay bearable in July.
Use ReloMaps for Cincinnati, Ohio to connect the climate picture to the address itself. That is the part newcomers should care about, because the right house in the wrong spot can turn a moderate climate into a daily problem.
Where Cincinnati Sits on the Climate Map
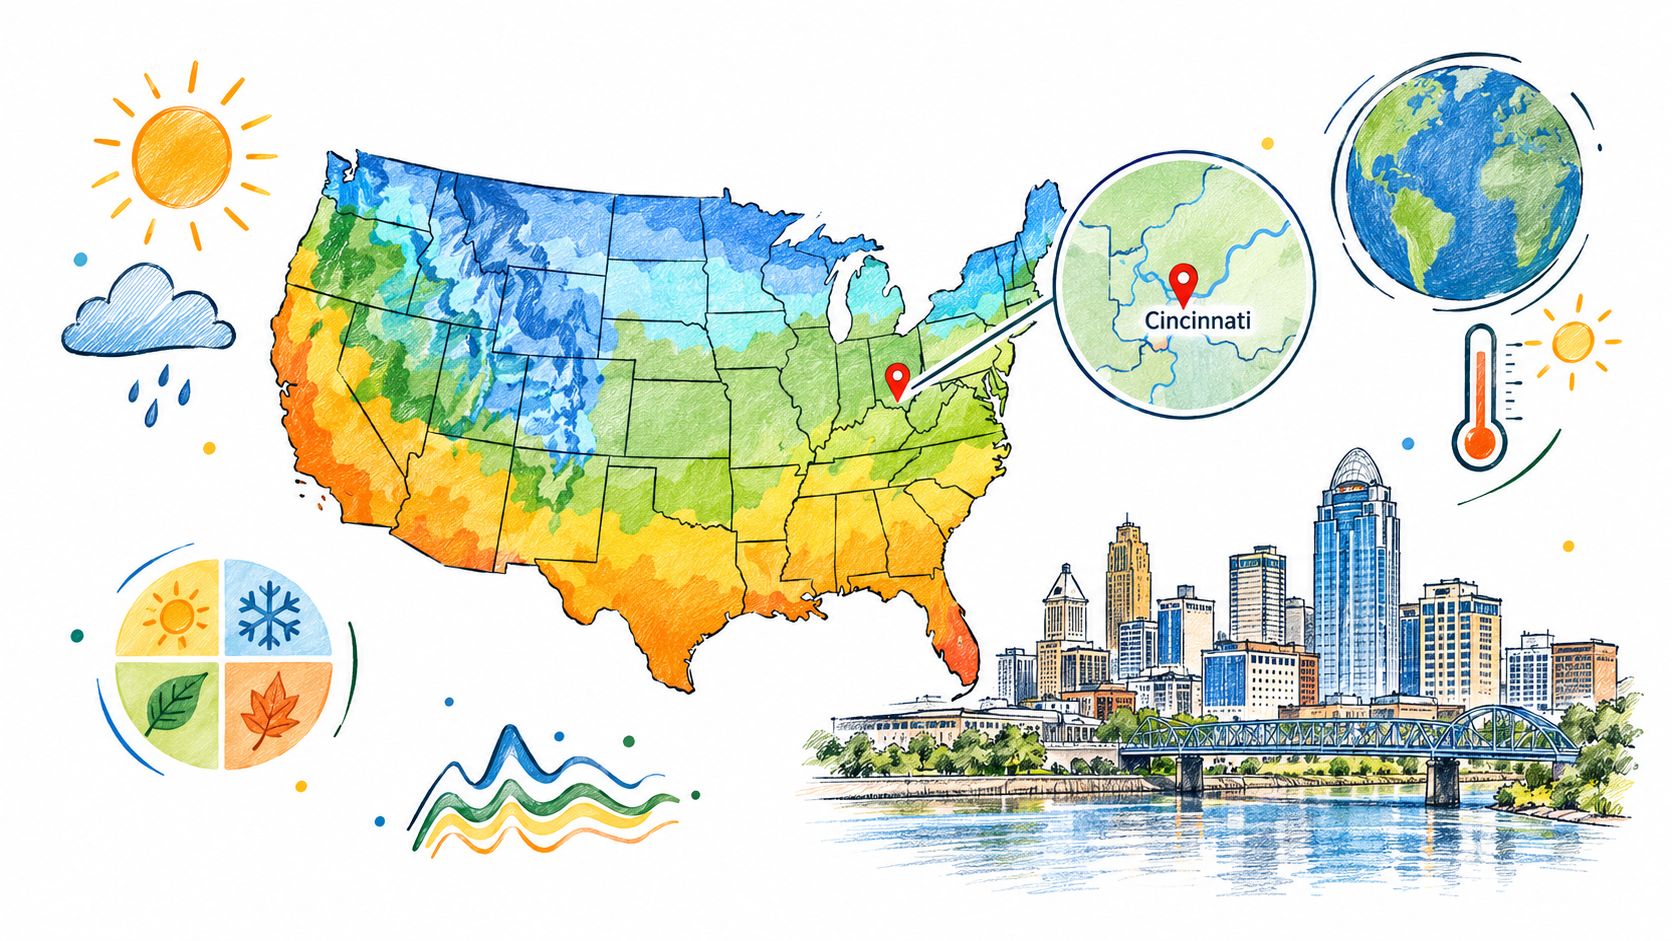
Cincinnati lives on a climate boundary, and boundaries create mixed experiences. It's close to the line between humid continental and humid subtropical conditions, which is why the city can feel softer in winter than much of Ohio while still getting genuine summer humidity. The Ohio River valley also gives the city a little moderation compared with places farther inland, and that difference shows up when temperatures dip and when cold air hangs around.
That geography is why Cincinnati doesn't behave like northern Ohio, and it also doesn't feel like a southern city that glides through winter. The city gets the middle ground, which sounds pleasant until you realize “middle ground” still includes sticky summers, muddy springs, and enough seasonal swing to affect heating, cooling, and outdoor maintenance.
Ohio climate comparisons help more than a generic state summary because Cincinnati's position matters relative to nearby markets, not just to the state average. The useful comparison is not “Is Cincinnati cold?” but “How does Cincinnati differ from places farther north where winters bite harder, or farther south where heat hangs on longer?”
What that boundary means for a household
The biggest practical difference is that winter tends to be milder than many Midwestern newcomers expect, while summer heat still arrives with enough force to strain comfort. That combination matters for HVAC planning, insulation choices, and what kind of yard work you'll be willing to do. It also matters for driving, because the city can get winter weather that is annoying enough to slow life down without turning into the deep-snow routine people associate with farther-north metros.
Cincinnati is not a city where climate disappears into the background. It influences how long you need to run heat, when you start using air conditioning, and how much weather-related maintenance you're signing up for.
The growing-season advantage is part of the same story. Cincinnati's climate position supports a longer warm-season window than many cities farther north in the Midwest, but that doesn't mean easy gardening or carefree outdoor living. It means more chances for things to grow, and more chances for heat and rain to work against you if the property is poorly drained or heavily paved.
A Season by Season Look at Cincinnati Weather
Winter and the first real cold
A Cincinnati winter is usually more annoying than brutal. Cold spells show up, ice shows up, and some stretches do bring snow, but the season rarely behaves like the hard, nonstop winters farther north. Newcomers are often surprised by how manageable it feels if the house holds heat well and the driveway gets treated before a storm freezes in.
What matters is the property, not the postcard version of the city. A steep driveway, an exposed roofline, or weak insulation turns an ordinary cold snap into a real hassle. If you are buying or renting, judge the home first and the season second.
Spring, summer, and fall in real life
Spring is where Cincinnati earns its wet reputation. May is the month that stands out in the climate normals, and the same normals behind the 27-day figure put May at 4.70 inches in National Weather Service climate normals for Cincinnati/Covington. Thunderstorms are part of the deal, and yards, sidewalks, and lower lots can get muddy fast.
Summer changes the problem from rain total to heat and humidity. The climate normals show a July average high in the upper 80s, and a January average high in the mid-30s, which tells you plenty about the swing residents live with through the year. That swing is why AC quality matters here, especially in older houses, top-floor units, and homes with little shade. Heat lands harder on west-facing streets, dense blocks with little tree cover, and homes that already trap warmth inside.
Fall is the season that usually feels easiest to live in. Evenings cool off, humidity backs down, and outdoor errands stop feeling like work. The catch is that Cincinnati can pivot toward winter quickly once late November arrives, so September comfort does not last as long as people hope.
| Cincinnati Monthly Climate Snapshot | Normal Precipitation (in) | Seasonal Character |
|---|---|---|
| January | 3.15 | Cold, damp, occasional ice |
| February | 2.79 | Drier winter month, still chilly |
| March | 3.84 | Early storms, fast-changing weather |
| April | 3.83 | Mild, unsettled, frequent rain |
| May | 4.70 | Wettest stretch, storm-prone |
| June | 4.14 | Humid, warm, thunderstorms |
| July | 4.59 | Hot, sticky, stormy evenings |
| August | 3.34 | Humid, still summer-like |
| September | 3.03 | More comfortable, less intense |
| October | 2.88 | Cooler, comparatively lighter rain |
| November | 3.05 | Cooler, transition toward winter |
| December | 4.05 | Damp, chilly, weather shifts |
Why Annual Rainfall Totals Mislead Cincinnati Residents
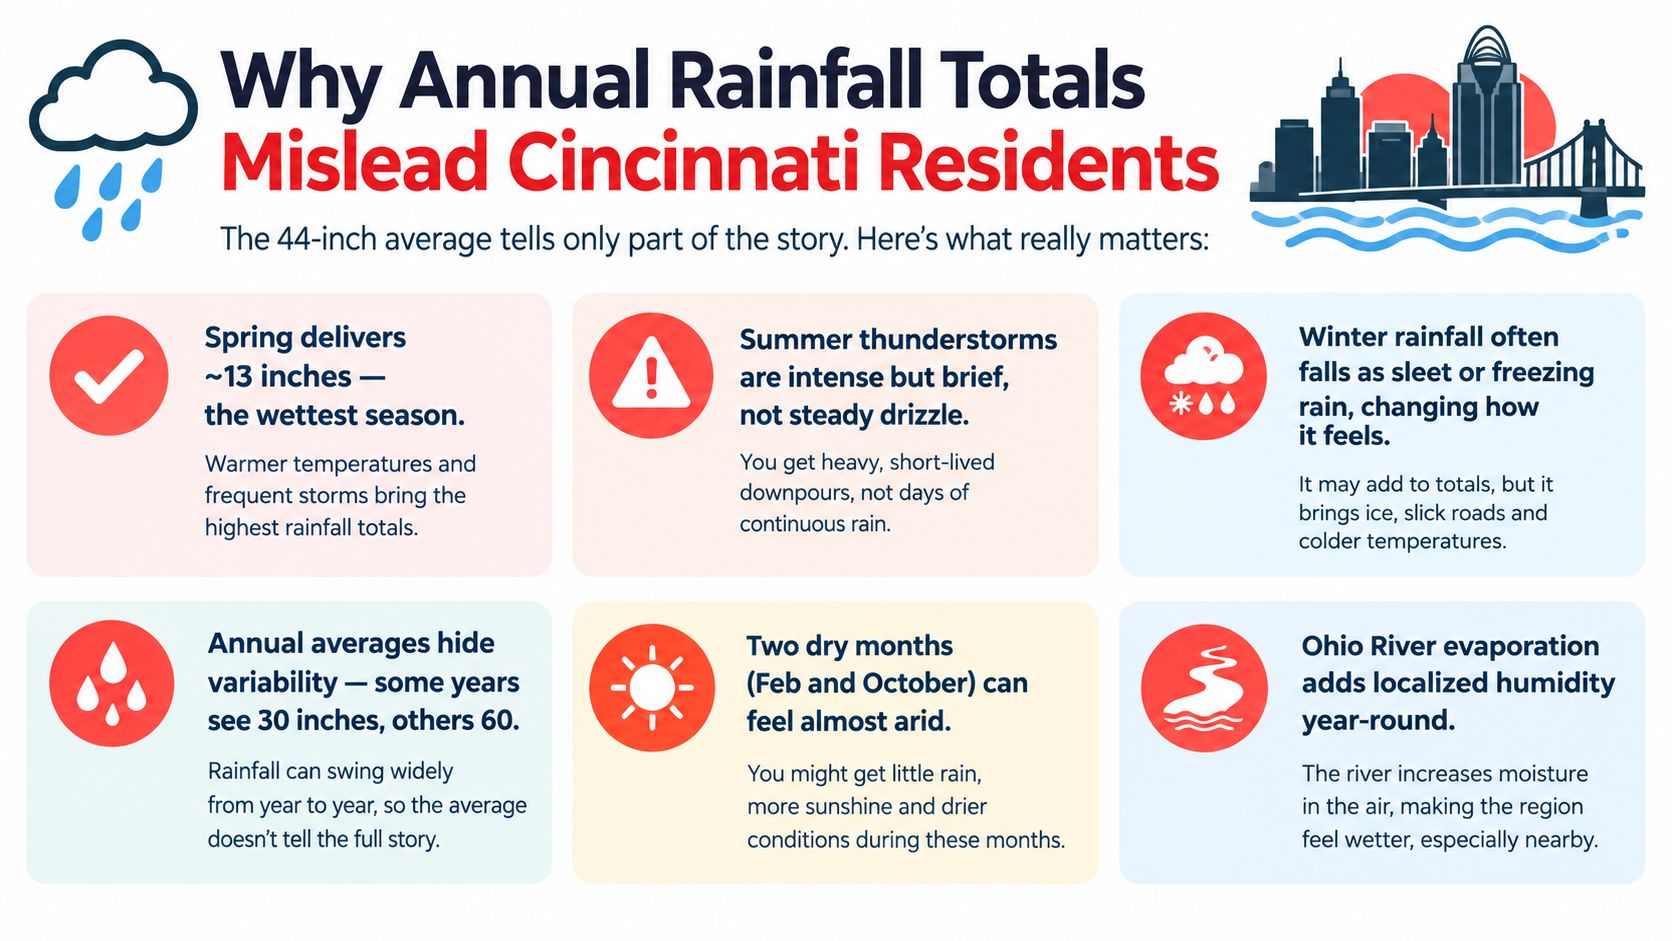
A city average like about 44 inches of rain a year sounds useful until you are choosing a house, a block, or even a side of the street. What matters on the ground is how hard the rain falls. Local analysis found average rainfall intensity increased 10% from 1970 to 2025, and Ohio's annual precipitation has risen about 0.26 inches per decade since 1896 (Cincinnati rainfall intensity analysis). That is the part homeowners feel first, because intense bursts are what overload drainage and turn a normal storm into a problem.
The citywide total hides too much. A house can look fine on a climate chart and still face seepage, runoff, or flash flooding when rain comes down fast. Older combined sewer systems, creek corridors, and steep lots matter more than the annual average. Mill Creek, ravine-adjacent streets, and low points near tributaries deserve a closer look than any citywide rainfall figure gives them.
NOAA's commonly used Atlas 14 rainfall estimates also leave out the most recent 26 years of observations, so older design assumptions can miss how storms behave now. That gap is part of the same city analysis. A smart buyer asks better questions than “Does Cincinnati get a lot of rain?” Ask whether the lot slopes toward the foundation, whether the sump pump has ever failed, whether there is a backwater valve, and whether nearby storm drains have been upgraded recently. Those answers tell you more than a yearly total ever will.
The address-level checklist that matters
- Slope and runoff: Water should move away from the house, not toward the basement wall.
- Sump pump history: Ask when it was installed, serviced, and tested.
- Backflow protection: Find out whether the sewer connection has a backwater valve.
- Creek proximity: Properties near drainage corridors need a harder look than standard listings get.
- Street drainage: A clean, fast-draining road after rain tells you more than a climate profile does.
Ohio River Flood History and What It Means for an Address
Cincinnati's flood history starts with the river, and that matters for any address close to the low ground. The National Weather Service keeps a continuous record of Ohio River flood crests and annual stages at Cincinnati beginning June 1, 1858, and the city's official flood-stage threshold has changed over time, from 45 feet between 1873 and 1893, to 50 feet from 1899 through March 31, 1922, and 52 feet since April 1, 1922 (National Weather Service flood records for Cincinnati).
The record crest should stay on your radar. In January 1937, the Ohio River reached about 79 feet 11 7/8 inches, nearly 80 feet, and that remains Cincinnati's historical flood record. Per the same NWS flood record, that is the scale of the city's worst-case river exposure.
Why the river still matters on a normal move-in day
The March 1997 flood shows how fast conditions can turn. Per the same NWS flood record, the river rose from about 31 feet on the morning of March 1 to about 51 feet the next morning. That kind of jump can push a neighborhood from routine to urgent in a single day.
Low-lying parts of Cincinnati and nearby communities take the hit first when the river runs high, and backwater flooding can move up tributary corridors such as the Little Miami and Great Miami. If you are sizing up a house, the question is not just whether it sits in a mapped floodplain. You also need to know how water reaches the parcel, where it backs up, and whether the basement has any protection at all.
That is why lender rules and disclosure questions matter too. For a plain-language overview of insurance triggers and why flood coverage can matter even away from a mapped zone, Eagle Restoration's guide to Marion County flood insurance requirements is a useful frame of reference.
A home can sit above the obvious river edge and still take on water from storm sewers, backup, or corridor flooding. Downtown protections help, but they do not replace parcel-level due diligence.
The Neighborhood-Level Heat Map Most Cincinnati Climate Articles Skip
A house on a tree-lined block can feel manageable, while a few streets over the pavement bakes and the air barely moves. Cincinnati's heat problem is uneven, and the city's 2020 urban heat-island community science campaign with NOAA shows that local heat exposure varies by neighborhood, not just by region (City of Cincinnati urban heat island community science campaign). Dense development, less shade, and more pavement push temperatures higher than they are in greener, less built-up areas.
That matters in a city that already sees roughly 30 days a year with a heat index above 90°F, with local reporting citing projections of as many as 79 days in coming decades (WVXU's report on projected Cincinnati heat-index days). One neighborhood may handle that load better than another, but the trend is clear enough for housing decisions.
What changes from block to block
The hardest-hit blocks tend to share the same setup. They have more impervious surface, less tree cover, denser housing, and poorer airflow. Lower-income households often feel that pressure more sharply because a home that is expensive to cool turns into a real safety problem during a long hot stretch.
A shady street can stay usable on a July evening while a nearby exposed block still feels trapped. That difference is enough to change where I'd buy.
Use block-level questions, not citywide averages. Ask which side gets afternoon shade, how much canopy sits over the roofline, how old the housing stock is, and whether the house can stay safe if the power cuts out during a humid spell. If a neighborhood feels fine at noon but punishing after sunset, that is a heat-island signal.
The right move is to compare neighborhoods one by one. Treat shade, roof color, AC dependence, and impervious-surface concentration as household variables, because they change comfort, cooling costs, and how a summer listing really lives.
Climate as a Relocation Variable, Not a Trivia Topic
A Cincinnati house can look fine and still be a poor climate buy. Weak insulation, an undersized HVAC system, little tree cover, and a basement with moisture history turn a home into a weather problem you will pay for every summer and after heavy rain.
Use a simple order. Check heat risk first, because it affects cooling load, shade, and whether a heat pump can carry the shoulder seasons. Check rain intensity next, because it changes how you judge sump pumps, drain tiles, and flood insurance, even outside the mapped floodplain. Then look at river history and disclosure language, since an address near water deserves more scrutiny than a listing photo suggests. For a shortlist built around hazard exposure, start with towns with the lowest natural disaster risk.
If you are cross-shopping Ohio, Ohio properties on Pie Assets helps widen the search, but climate still belongs near the top of the filter list. Shade, drainage, and summer cooling load change operating costs in ways listings hide.
That is the order that matters for buyers. Check flood exposure, then heat exposure, then the house systems themselves. If a listing fails those three checks, the rest of the pitch does not matter much.
Frequently Asked Questions About Climate in Cincinnati Ohio
How many 90°F days does Cincinnati get, and could that number rise?
If you're comparing houses, start with the heat burden, not the postcard view. Cincinnati's climate normals show typical July temperatures around the upper 80s for highs and the upper 60s for lows, which tells you the summer baseline is already warm before a heat wave shows up National Weather Service climate normals for Cincinnati/Covington. As covered in the heat-island section, projections point toward far more heat-index days, so shade, attic insulation, and AC capacity matter more than lawn size or fresh siding.
Does Cincinnati get hurricanes or tornadoes in any meaningful way?
Severe storms are the key issue. For a buyer, the question is whether the home has a safe interior refuge, dependable power backup, and drainage that can handle fast-moving rain.
Do you need flood insurance outside a mapped floodplain?
Yes, and you should take that seriously. Homes outside the mapped floodplain can still take water from heavy downpours, sewer backup, and backwater flooding, especially near creeks, low spots, and older stormwater systems.
What is winter driving like in Cincinnati?
Winter driving is usually manageable, but the trouble comes fast when roads glaze over. Ice and quick freezes cause more problems than long stretches of snow. A shaded street or steep driveway can stay slick well after the main roads improve.
Will typical Midwest lawns and gardens work in Cincinnati?
Yes, if the yard matches the site. Cincinnati's growing season gives plants a fair shot, but clay-loam soils, summer humidity, and storm runoff make sun exposure, drainage, and compaction just as important as the plant list. Yard success here starts with the ground, not the catalog.
Enjoying the blog? Subscribe to ReloMaps+ for premium area intelligence — and to keep us independent.
Subscribe today