7 Best Richmond Neighborhoods for 2026

The best Richmond neighborhood depends on your priorities, not on a single winner. Short Pump leads on market speed and higher-end suburban demand, The Fan District leads on walkability, and areas such as Church Hill, Manchester, and Northside can offer stronger value or emerging-market appeal.
Richmond's most competitive neighborhoods aren't the most expensive. In the latest neighborhood snapshot, Short Pump has a $535,000 median price, 1.7 months of inventory, and 16 days on market, while The Fan District has $485,000, 1.9 months of inventory, and 19 days on market. The broader Richmond metro sits at about $418,000, 2.1 months of supply, and 22 days on market (Richmond market report). Buyers targeting fast-moving areas need financing ready, rapid tour-to-offer workflows, and realistic concession assumptions.
This comparison evaluates seven Richmond-area neighborhood research tools through a repeatable buyer-fit framework: ReloScore grades, affordability, schools, commute realities, safety context, walkability, and trade-offs. The selected tools are ReloMaps, BestNeighborhood.org, HomeSnacks, Zipstead, OCity, AreaVibes, and The Wilson Group. Together, they cover Richmond City, Henrico, and Chesterfield perspectives, but none can replace current listings, school-assignment verification, crime-detail checks, property inspections, or an in-person visit.
Table of Contents
- 1. ReloMaps
- 2. BestNeighborhood.org
- 3. HomeSnacks
- 4. Zipstead
- 5. OCity
- 6. AreaVibes
- 7. The Wilson Group
- Best Richmond Neighborhoods: 7-Source Comparison
- Turn the Shortlist Into a Defensible Move
1. ReloMaps
ReloMaps is the strongest starting point when “best Richmond neighborhoods” means best fit for a specific household, rather than highest placement on a generic list. The platform combines civic, economic, safety, lifestyle, and location data into a ReloScore from A+ to F, alongside category grades that let buyers compare places on consistent dimensions.
That distinction matters because Richmond's top neighborhood changes with the metric. A safety-focused ranking places University of Richmond, Windsor Farms, Colonial Place, and Westhampton near the top for low crime, while market data identifies Far West End as the highest-priced submarket at $734,250 and Near West at $509,975 (Richmond neighborhood safety and market comparison). Walkability-focused coverage instead highlights The Fan District, Church Hill, Carytown, Scott's Addition, Jackson Ward, and Museum District, with Walk Scores ranging from 82 to 93 (Richmond walkability coverage). Those aren't contradictory findings. They answer different buyer questions.
Why the framework is useful
ReloMaps surfaces context that listing portals usually leave scattered across separate searches. Buyers can compare affluence, cost of living, crime and safety, education, home values, rents, commute times, work-from-home rates, disaster exposure, and strategic location. The platform also includes personal-sovereignty indicators, such as tax burden, firearm freedom, homeschool freedom, raw-milk legality, gambling freedom, and marijuana status.
Its practical advantage is constraint-based research. An urban buyer can prioritize walkability and commute proximity. A family can emphasize education, safety, and housing cost. A remote worker can examine homeownership, work-from-home conditions, hazards, and access to major cities. The Grid and Map views support side-by-side filtering, while the property lookup can accept a Zillow or Redfin URL and return neighborhood and city intelligence for that listing.
Practical rule: Use a score to create a shortlist, then verify the finalist property at the block, school-assignment, commute, and inspection levels.
ReloMaps isn't an MLS, transaction platform, or replacement for an agent. Public pricing and access details aren't presented as a standard per-user subscription, although the site provides report samples and advertising or enterprise access information. Its best role is as a relocation analytics platform that prevents buyers from treating listing photos or one composite ranking as the whole decision.
2. BestNeighborhood.org
BestNeighborhood.org is built for buyers who want a standardized neighborhood ranking before they invest time in deeper research. Its Richmond page is presented as a 2026–2027 edition, with data refreshed in July 2026 (BestNeighborhood.org Richmond rankings). That recent refresh gives it a useful role in a fast-changing market, particularly when older listicles still shape search results.
The platform's value comes from consistency. It applies a recurring “BestNeighborhood” score across categories such as housing, safety, and amenities, then places neighborhoods into a comparable ordering. A map-based browsing experience also helps readers move beyond a fixed list and inspect adjacent districts. For someone arriving in Richmond without a strong geographic mental model, that structure can quickly reveal which areas deserve a closer look.
Where the ranking helps
A standardized score is especially useful for first-pass comparison. Rather than reading separate descriptions of The Fan District, Museum District, Church Hill, or Northside and trying to remember which one performed better, a buyer can view the same general scoring framework across multiple areas.
The site also covers Richmond neighborhoods and nearby districts, which supports a metro-wide search rather than a city-only search. That matters because Richmond-area buyers often compare city neighborhoods against Henrico or Chesterfield alternatives with different housing, school, and commute conditions.
Where the ranking stops
The methodology is described at a summary level, but the underlying datasets and weighting aren't fully transparent at the granular level. A buyer therefore shouldn't treat the composite score as a causal explanation. A neighborhood may rank well because of amenities while carrying a housing-cost or school-assignment trade-off that matters more to a particular household.
Use BestNeighborhood.org as a screening instrument, not a final verdict. Save the top candidates, then compare them against the same affordability, school, commute, safety, and risk criteria in a second system. The July refresh makes the page timely, but “current” still doesn't mean that every listing, boundary, public-safety record, or school assignment reflects the buyer's exact situation.
3. HomeSnacks
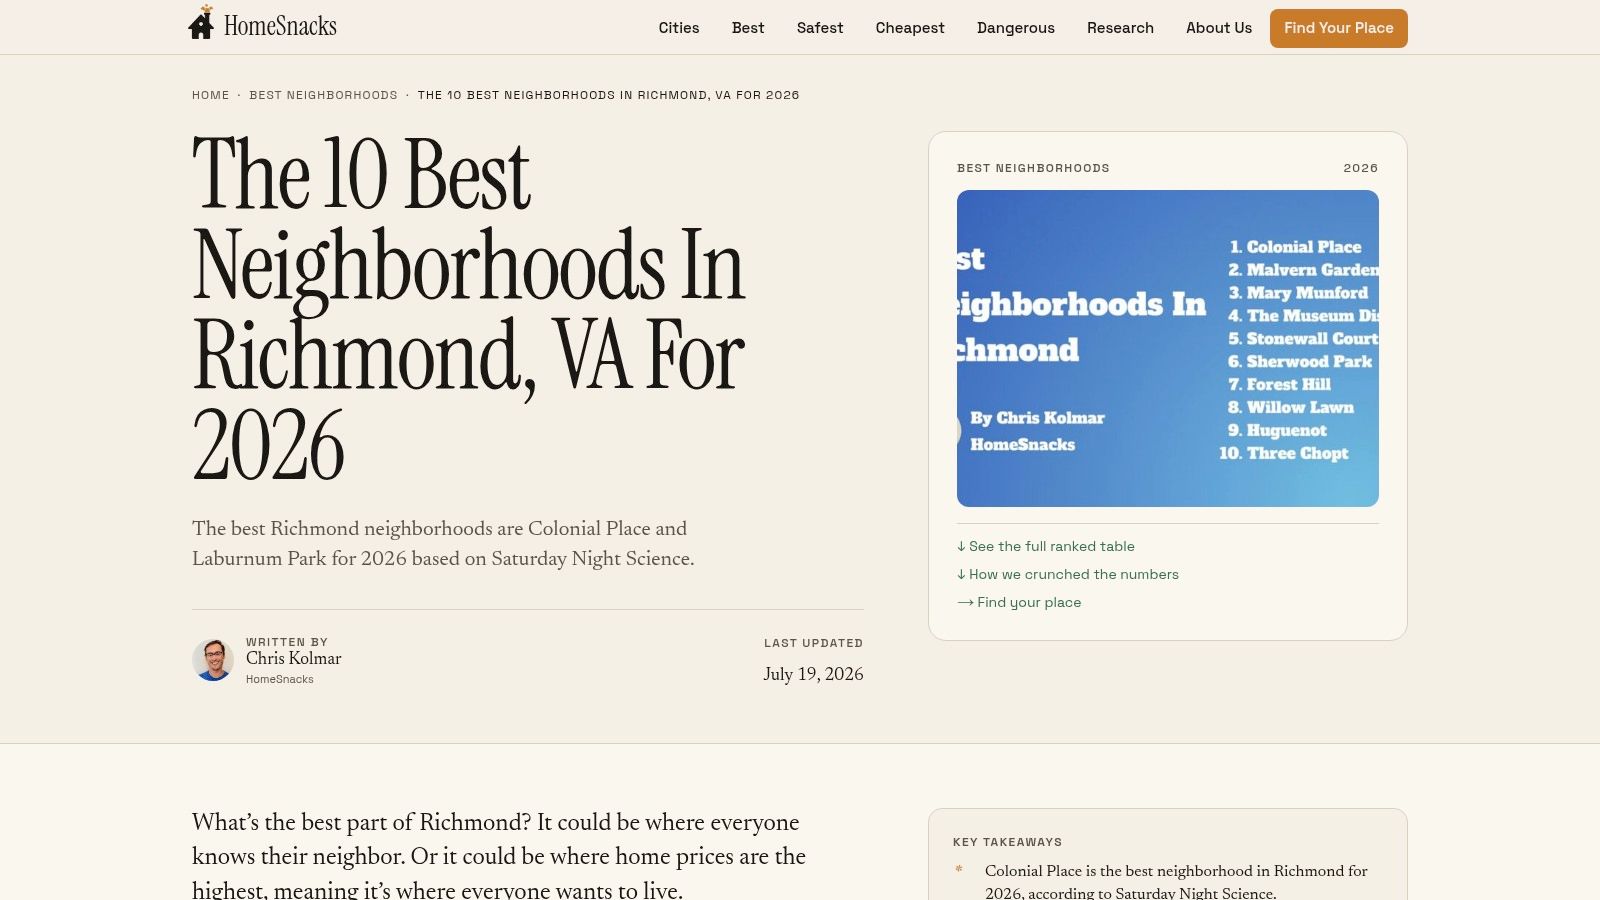
HomeSnacks takes a simpler route. Its 2026 Richmond Top-10 list uses Census and Bureau of Labor Statistics inputs, then applies the site's internal scoring approach to create an easy-to-digest neighborhood ranking (HomeSnacks Richmond neighborhood list).
That format works well for orientation. A buyer who knows Richmond only by broad labels can use the list to identify possible starting points, then consult companion pages focused on themes such as wealth or safety. The short explanations also make the tool accessible to readers who don't want to begin with a technical dashboard.
The strength is speed
HomeSnacks is useful when the buyer needs a quick, broad shortlist. Its city-specific presentation avoids the common problem of burying Richmond within a national relocation report. The companion lists add a second lens, allowing a reader to ask whether a neighborhood that appears in an overall ranking also appears in a safety- or wealth-oriented view.
That cross-check can expose a central Richmond trade-off. The safest areas aren't automatically the most walkable, and the most expensive areas aren't automatically the best value. Independent Richmond research shows that neighborhood rankings vary substantially depending on whether the metric is safety, price, walkability, or composite livability. AreaVibes likewise places The Fan and Museum District near the city's top tier while ranking Brookbury and Belmont Woods much lower on composite livability measures (Richmond neighborhood livability rankings).
The limitation is granularity
HomeSnacks summarizes its inputs and method, but the internal definition of “best” can flatten distinctions that matter to buyers. Short blurbs can't establish whether a specific block feels suitable, whether a school boundary applies to a particular address, or whether a commute works at the household's actual departure time.
Use the list to create candidates, then move into Virginia relocation and neighborhood data for a more structured comparison. HomeSnacks is a useful doorway, but it shouldn't be the only evidence behind a purchase decision.
4. Zipstead
Zipstead is aimed directly at relocation readers who want rankings plus a sense of daily life. Its Richmond guide publishes a 2026-ranked list and adds lifestyle commentary about walkability, culture, landmarks, and neighborhood identity (Zipstead Richmond neighborhood guide).
That combination fills a gap left by purely quantitative portals. A score may tell a buyer that The Fan District or Museum District deserves attention, but narrative context helps explain why. Richmond walkability coverage identifies The Fan District, Church Hill, Carytown, Scott's Addition, Jackson Ward, and Museum District as leading walkable areas, with Walk Scores between 82 and 93 (Richmond walkability comparison). For a buyer who values errands, restaurants, museums, or a shorter car-dependent routine, that information changes the shortlist.
Narrative makes trade-offs visible
Zipstead's neighborhood-by-neighborhood explanations are most useful for buyers who haven't yet translated lifestyle preferences into location criteria. The Fan District, Museum District, Scott's Addition, and Church Hill may all appeal to someone seeking centrality, but they don't offer the same housing environment, density, or street-level experience.
The guide's relocation orientation also makes it easier to consider the Richmond metro beyond a single city boundary. Someone moving for work may value central neighborhoods, while a family may give more weight to school systems, yard space, or suburban access. Those are different definitions of convenience, and a lifestyle guide can surface the distinction earlier than a numerical ranking.
Narrative needs a data check
Zipstead's methods and sourcing are less detailed than those of a dedicated data portal. Its coverage also emphasizes popular neighborhoods, so a less frequently marketed pocket may not receive equal attention.
Treat the prose as a set of hypotheses. If a neighborhood sounds right, test it against current housing data, school assignments, safety information, commute conditions, and risk indicators. The best use of Zipstead is not to accept its ordering, but to identify the why behind a candidate and then determine whether that why matches the buyer's actual routine.
5. OCity
OCity takes a lifestyle-first approach rather than presenting a formal overall ranking. Its 2026 Richmond guide organizes neighborhood descriptions around preferences such as walkability, history, nightlife, museums, parks, and cultural access (OCity Richmond neighborhood guide).
That structure is valuable for readers who don't know their preferred neighborhood yet but do know how they want to live. A buyer may start with “walkable and historic,” “close to museums,” or “active nightlife” instead of a target ZIP code. OCity translates those preferences into recognizable Richmond areas, including The Fan District, Museum District, and Scott's Addition.
Best for preference discovery
OCity's plain-English summaries help newcomers make an initial emotional and practical connection to a place. That matters because relocation decisions aren't driven only by price or safety. Daily access to parks, cultural sites, restaurants, and social activity can determine whether a household enjoys the routine after the move.
The guide is particularly helpful when comparing neighborhoods that appear together in walkability coverage. The Fan District, Church Hill, Carytown, Scott's Addition, Jackson Ward, and Museum District all score highly on that lens, but “walkable” can mean different things. It may refer to restaurants and nightlife, museum access, errands, historic streets, or proximity to employment. A buyer should ask which type of walking the household needs.
Lifestyle fit isn't a full underwriting model
OCity isn't a formal data ranking, and it uses lighter quantitative detail than a location-intelligence dashboard. It may also omit smaller sub-neighborhoods that deserve consideration. That makes it strong for discovery but weaker for comparing affordability, school conditions, commute reliability, and hazards on a consistent basis.
Pair its lifestyle categories with an explicit decision matrix. For example, a buyer could shortlist The Fan District for walkability, then test whether its housing costs, school options, safety context, and commute fit the household. OCity answers “where might I enjoy living?” It doesn't answer every part of “where should I buy?”
6. AreaVibes
AreaVibes is the specialist in this comparison. It focuses on reported crime rates and relative safety comparisons across Richmond neighborhoods, rather than attempting to define the overall best place to live (AreaVibes safest Richmond neighborhoods).
That narrow focus is useful because safety is often treated either as a vague reputation or as one misleading citywide average. Richmond-specific public-data work has combined Richmond Police Department crime data with census tracts and official city neighborhood geographies, showing why neighborhood-scale analysis is more informative than a single metro or city number (Richmond neighborhood crime geography research). The Federal Reserve Bank of Richmond's regional community research similarly emphasizes administrative and public data for measuring neighborhood property values, investment, distress, vacancy, and housing characteristics (Richmond neighborhood data research).
Safety should narrow the search
AreaVibes' simple ranking layout and area report cards can help a buyer identify lower-crime pockets for further investigation. Independent safety coverage places University of Richmond, Windsor Farms, Colonial Place, and Westhampton near the top for low crime. That finding gives a safety-conscious household a reasonable group of places to compare, but it doesn't establish that every street or property has the same conditions.
A safety ranking identifies where to investigate next. It doesn't certify a property, block, school route, or future experience.
Crime data can have reporting, timing, classification, and geographic-boundary limitations. Buyers should inspect the underlying methodology and compare the result with official public information, current local conditions, and visits at different times. Safety also can't answer whether a neighborhood offers the right schools, housing costs, walkability, or commute.
For broader shortlisting, use interactive Richmond location comparisons alongside AreaVibes. The two tools serve different purposes. AreaVibes helps ask, “Which places should I investigate for safety?” A multi-factor platform helps ask, “Does that place still fit my budget, school priorities, commute, lifestyle, and risk tolerance?”
7. The Wilson Group
The Wilson Group supplies a local brokerage perspective that national ranking sites can't fully reproduce. Its 2025 guide covers popular Richmond neighborhoods across Richmond City, Henrico, and Chesterfield, with commentary on buyer demand, pricing pressure, and competitiveness (The Wilson Group Richmond neighborhood guide).
That metro-wide coverage matters for buyers who aren't committed to a city-versus-suburb decision. Short Pump, for example, can appeal to households prioritizing schools, shopping, and suburban convenience, while The Fan District may appeal to buyers who want walkability and central access. The comparison becomes more useful when a local source explains how demand is distributed across the region rather than treating Richmond as one uniform market.
Local texture improves timing decisions
A brokerage guide can add practical market texture around which areas attract attention and where buyers may face stronger competition. The latest Richmond snapshot supports that concern: Short Pump's 1.7 months of inventory and 16 days on market indicate faster turnover than the metro's 2.1 months and 22 days (Richmond market conditions). Buyers who use a popular-neighborhood guide without adjusting offer timing, pre-approval readiness, or concession expectations may underestimate execution risk.
The guide's weakness is its viewpoint. It reflects a brokerage lens and a 2025 perspective, so it may emphasize areas with strong buyer visibility, higher demand, or luxury appeal. It also isn't a substitute for a standardized, transparent cross-neighborhood score.
Use local commentary to understand market behavior, then test the claims through the Richmond, Virginia location profile. That combination is stronger than either source alone. The Wilson Group adds current human context, while structured location data helps keep the comparison consistent across neighborhoods and counties.
Best Richmond Neighborhoods: 7-Source Comparison
| Name | Data transparency & depth | Resource / Access requirements | Expected outcomes | Ideal use cases | Key advantages |
|---|---|---|---|---|---|
| ReloMaps | High, multi-domain datasets, transparent sub-scores, granular filters | Web platform; some enterprise/premium features require provider contact; no public per-user price | Decision-quality neighborhood & city context; tradeoff-based shortlists | Buyers, families, investors, remote workers needing multi-factor comparisons | Comprehensive indicators (sovereignty, disaster risk), property-URL parsing, interactive Grid/Map |
| BestNeighborhood.org | Moderate, standardized scores with methodology notes; recent data refresh (Jul 2026) | Free web pages with public rankings | Quick, comparable neighborhood ranking snapshots | Users wanting up-to-date, methodology-driven comparisons | Recent refresh and consistent scoring for fast cross-comparison |
| HomeSnacks | Moderate, Census/BLS inputs, summarized methodology | Free list-style web articles | Simple Top‑10 orientation and quick reference | Casual users seeking an easy, digestible neighborhood shortlist | Clear Top‑10s and companion lists for additional angles |
| Zipstead | Low–Moderate, ranked lists plus qualitative context; methods less detailed | Free relocation guides online | Ranked ordering with lifestyle narrative | Movers who want both ranking and day-to-day living context | Balances quantitative rank with qualitative insights (walkability, culture) |
| OCity | Low, lifestyle-first summaries with light quantitative metrics | Free neighborhood guides | Match neighborhoods to preferred vibes and life stages | Readers prioritizing lifestyle fit over numeric ranks | Plain-English summaries organized by lifestyle and life-stage |
| AreaVibes | Moderate, crime-focused metrics with methodology caveats | Free safety reports and area report cards | Identify lower-crime pockets for follow-up investigation | Buyers prioritizing safety evaluation | Focused safety lens and quick relative crime comparisons |
| The Wilson Group (Richmond real estate) | Low–Moderate, hyperlocal brokerage commentary; 2025 vantage point | Free brokerage guide; on-the-ground perspectives | Market texture: pricing pressure, buyer demand, competitiveness | Active buyers and agents needing local timing and competition insights | Local, agent-sourced intelligence on demand and neighborhood competitiveness |
Turn the Shortlist Into a Defensible Move
The best Richmond neighborhood is the one that survives a consistent test against your household's priorities. Don't begin by asking which area ranks first. Begin by identifying what can't be compromised, what can flex, and what would create an unacceptable daily or financial burden after closing.
Use a three-stage process.
- Rank priorities. Separate budget, schools, commute, safety, walkability, and risk into must-have, preferred, and flexible categories. Include practical constraints such as school assignment, parking, property condition, flood exposure, and whether the commute works at the actual time you'll travel.
- Compare all seven candidates consistently. Apply the same ReloScore and category-grade framework to Short Pump, The Fan District, Museum District, Church Hill, Manchester, Northside, and Scott's Addition. Don't compare one neighborhood by safety and another by lifestyle narrative. Use the same categories for every finalist.
- Validate specific properties. Check current listings, confirm school assignments with the relevant school system, review available public-safety details, test the commute from the exact address, visit the neighborhood at different times, and ask local professionals about inspection, insurance, utilities, and property-specific conditions.
A copyable decision matrix can keep preferences from changing mid-search:
Richmond's market data shows why speed belongs in the process. Higher-priced submarkets can turn over faster than the broader metro, so a buyer may need financing readiness and a rapid offer workflow even when the neighborhood appears expensive. At the same time, emerging areas deserve a separate value test. Recent reporting lists Manchester at $355,000 with a 7.2% year-over-year gain, Church Hill at $330,000 with a 5.6% gain, and Northside at $285,000 with a 6.1% gain as of July 2026 (Richmond neighborhood price reporting). Those figures point to movement, not an automatic investment recommendation.
ReloMaps is a research layer, not a listing service, MLS, inspection, appraisal, or agent replacement. Its advantage is that it lets buyers compare neighborhood data across multiple dimensions before they spend time touring properties. Use the platform to create a defensible shortlist, then use listings, school authorities, local records, inspectors, agents, insurers, and direct observation to make the final decision.
ReloMaps brings ReloScore grades, neighborhood context, safety and cost indicators, commute filters, school-related data, and property lookups into one research workflow for Richmond-area buyers. Visit ReloMaps to compare Richmond neighborhoods against your actual priorities before scheduling tours or making an offer.
Enjoying the blog? Subscribe to ReloMaps+ for premium area intelligence — and to keep us independent.
Subscribe today